Wavefront has added a Dynatrace integration to its portfolio of over 200 pre-built integrations. With this integration, Wavefront customers can easily ingest all or selected metrics from the Dynatrace SaaS solution.
From Wavefront, customers can easily correlate application metrics from Dynatrace with full-stack metrics from the rest of their environment – e.g. multicloud, Kubernetes, infrastructure – to accelerate incident detection and troubleshooting. Additionally, with Wavefront’s ability to retain metrics long-term with no roll-ups, customers can easily retain all their operational telemetry in a unified repository, including Dynatrace SaaS telemetry, for long and perform trend analytics. In this blog, we cover Wavefront’s Dynatrace integration and detail the many benefits engineering teams gain when ingesting Dynatrace data into Wavefront.
Below are some key advantages of ingesting and analyzing Dynatrace metrics with Wavefront:
- Troubleshoot faster with automated analytics running on a full-stack of data
- Improve situation awareness with a first-pane-of-glass to monitor all apps, infra, and multi-cloud
- Plan more accurately, using retained metrics for long term at full resolution
 Wavefront Dynatrace integration
Troubleshoot Faster with Automated Analytics on a Full-Stack of Data
When you get an alert, for instance, a service level objective (SLO) that is violated, you need to investigate quickly and find the root cause, so you can reduce and remediate any customer impact. In Wavefront, you can quickly see a full-stack view with performance metrics from different applications, infrastructure, and multicloud. Furthermore, if you need to drill down into certain specific application metrics from Dynatrace, now you can do that with the Dynatrace integration. Finally, with Wavefront’s query library of 120+ analytics functions, you can easily correlate Dynatrace metrics with other full-stack metrics in Wavefront – finding hidden anomalies that other tools won’t see – and accelerate incident troubleshooting.
Get Situational Awareness with a First-Pane-Of-Glass for all Apps, Infra, and Multicloud
Customers use Wavefront to monitor applications, containers, and infrastructure running on multiple clouds. Some customers also use Dynatrace for a handful of applications, to get deep application metrics to help in debugging. Now with Wavefront’s Dynatrace Integration, you can easily ingest Dynatrace metrics into Wavefront. As a first-pane-of-glass, Wavefront provides visibility into all apps – monitored by Wavefront and by Dynatrace – along with visibility into infrastructure and multi-cloud – summarized on single dashboards. Furthermore, with Wavefront as the first-pane-of-glass, you can now consolidate and ensure more consistent alerting across your full-stack environment in one place.
Plan More Accurately Using Retained Metrics for Long Term at Full Resolution
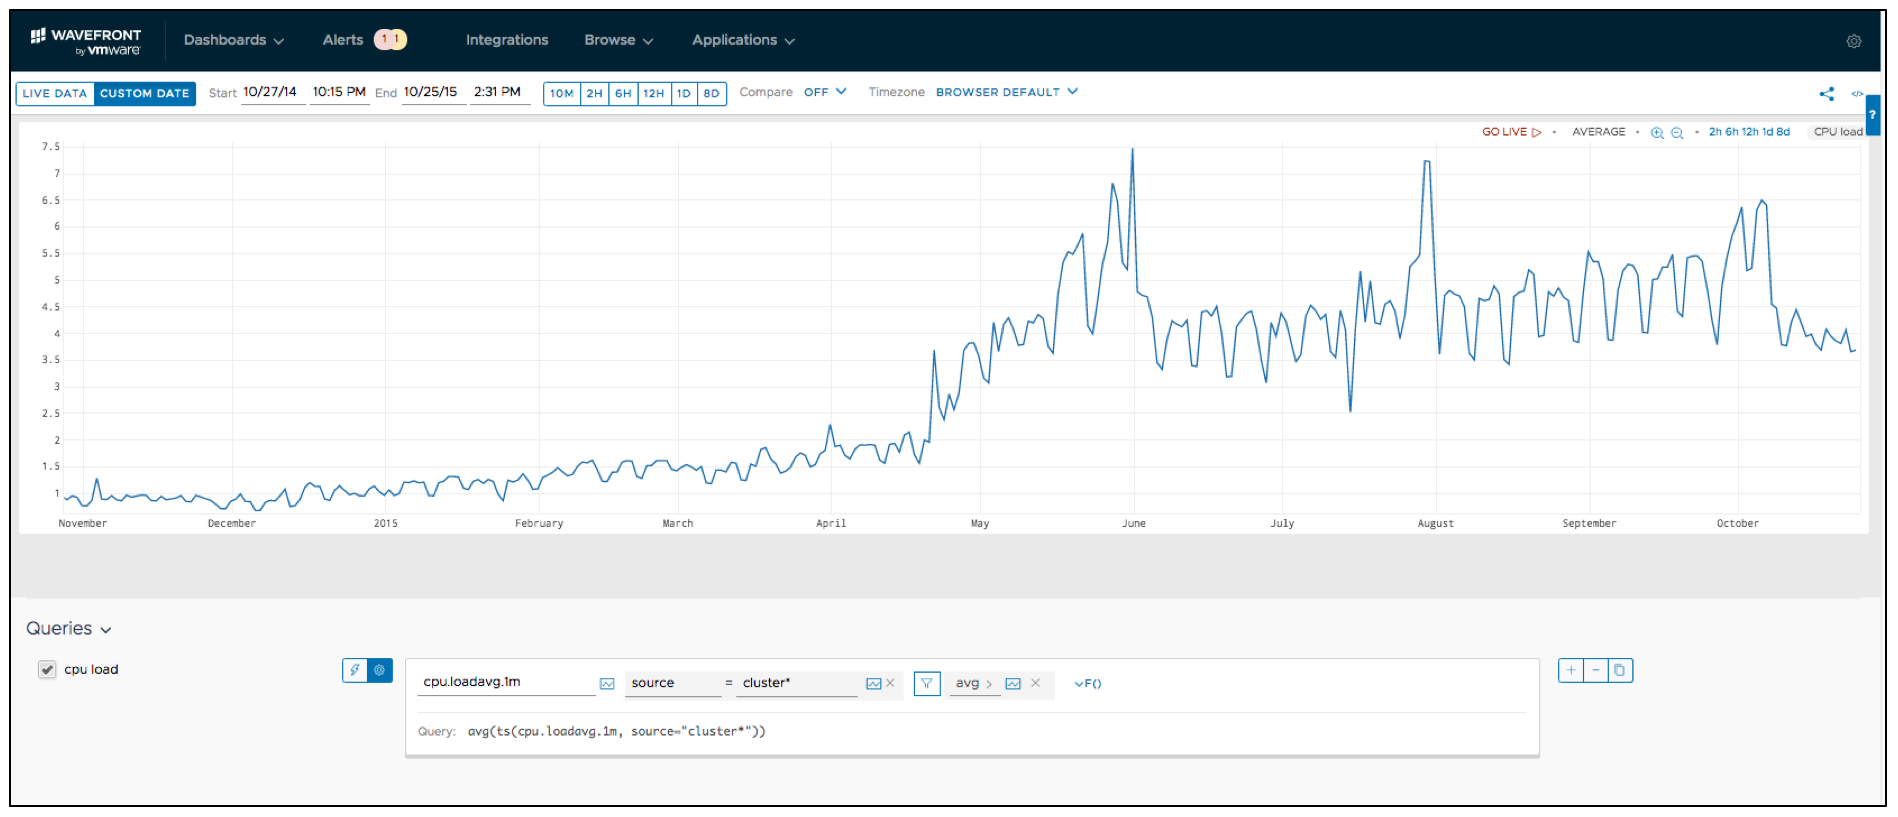
Customers love Wavefront’s ability to retain metrics long term at full resolution, so they can run analytics and recognize quarterly and annual trends in their data. Most other monitoring tools, including Dynatrace, are limited to short term metrics retention and aggressively roll-up metrics, losing all the outlier details with averaging. For instance, time-series metrics are retained at full granularity only for 14 days in Dynatrace, beyond which they are aggressively rolled up into 5 minutes, 1 hour and 1-day intervals.
With Wavefront, you can retain all metrics long-term – 18 months or more – with full granularity. Combined with its industry-leading analytics engine and a massive library of analytics functions, Wavefront enables customers to not only retain metrics for troubleshooting later but also perform long-term trend analyses.
 Over a year of metrics retained in Wavefront at the full granularity
Easily Ingest Dynatrace Metrics into Wavefront
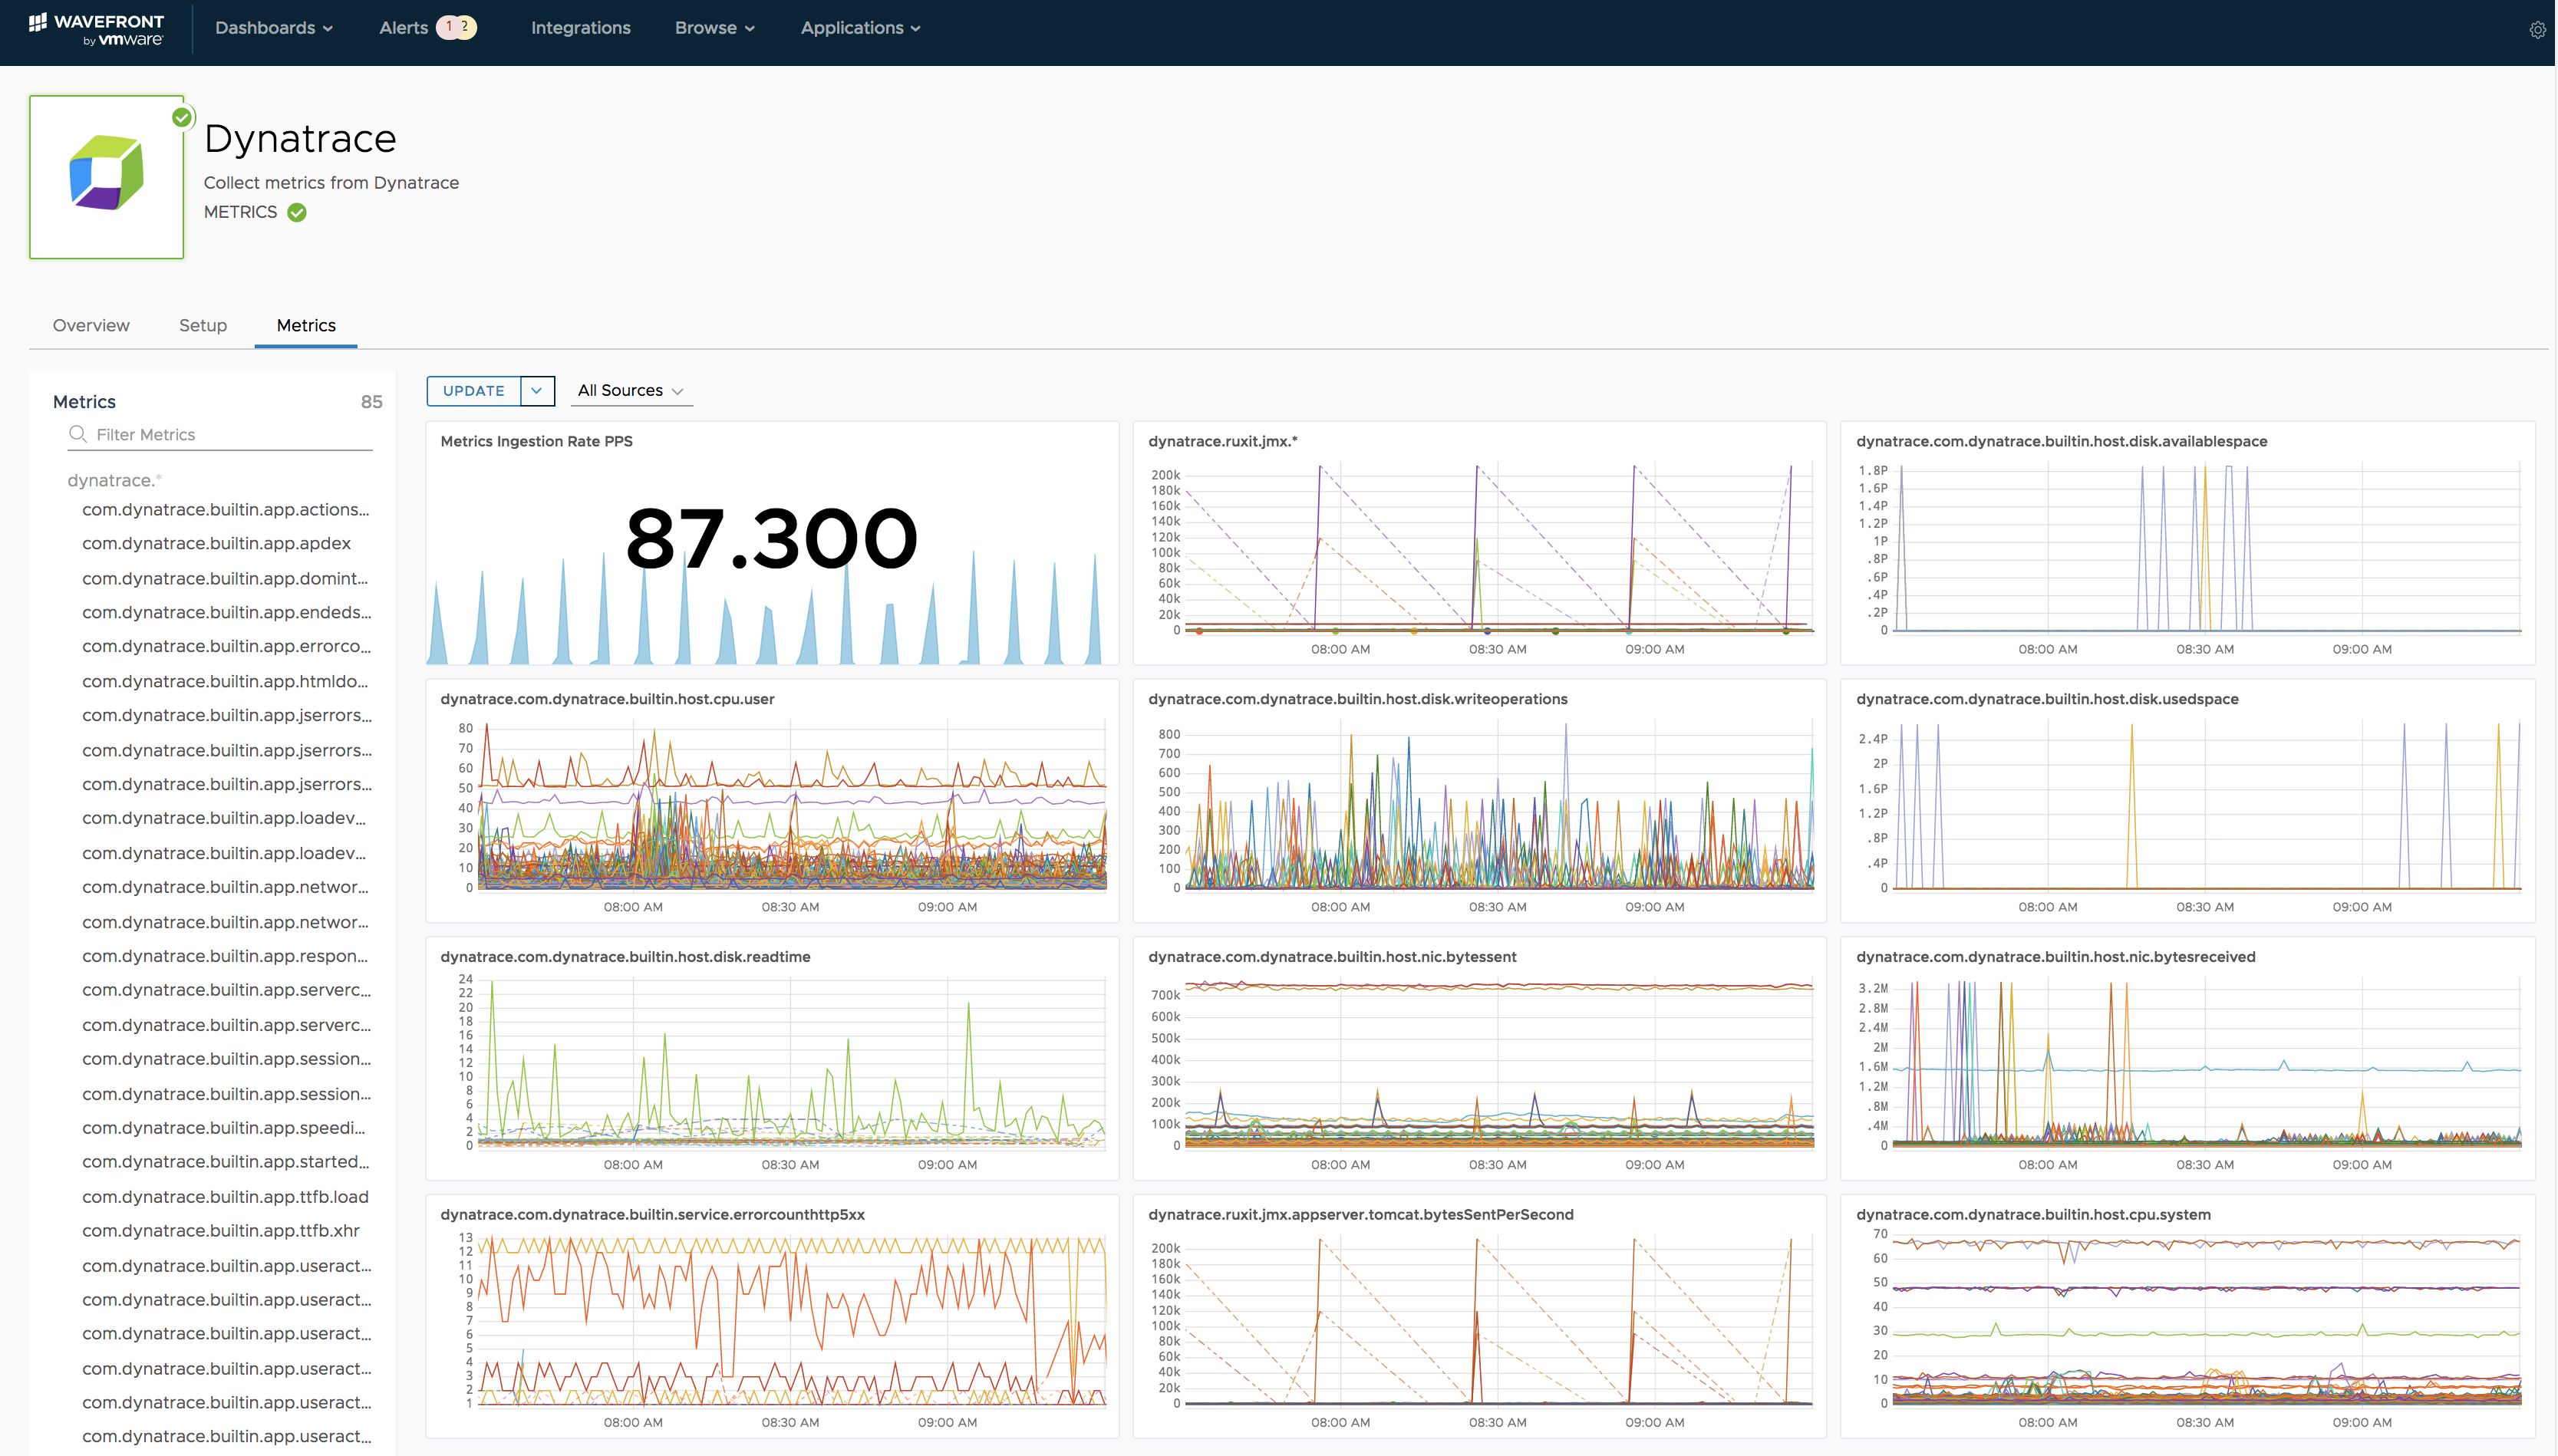
Based on popular request from many customers who use both Wavefront and Dynatrace, we have now introduced a Dynatrace integration in Wavefront. This integration can be configured to pull all application metrics from Dynatrace. You can choose to pull only specific application metrics by configuring appropriate filters. After you set up the integration, you can browse the available metrics in the Wavefront Metrics Browser and apply over 120 analytics functions, pre-built in Wavefront.
 Dynatrace metrics seen in Wavefront’s Metric Browser
Wavefront ingests different kinds of Dynatrace metrics including process, host, service and application metrics. Which Dynatrace metrics should be imported into Wavefront can be easily configured in the config file, located at /opt/wavefront/dynatrace/config/config.json
 Dynatrace Metrics to be imported to Wavefront can be easily configured in Config.json
Get an Open, Standards-Based Distributed Tracing Solution with Wavefront
In addition to the metrics, if you are looking for a complete observability solution with distributed tracing, Wavefront delivers just that. Wavefront Distributed Tracing is complaint with well-known distributed tracing standards including OpenTracing and OpenCensus. So, don’t get vendor locked-in with propriety tracing solutions and checkout Wavefront Distributed Tracing.
 Wavefront Distributed Tracing showing the service map and detailed trace view
Summary
Wavefront has recently added a Dynatrace integration to its portfolio of over 200 integrations. Now with Wavefront’s Dynatrace integration, customers can easily ingest all or selected Dynatrace metrics into Wavefront and correlate them with other full-stack metrics from the rest of their environment – e.g. multicloud, Kubernetes, infrastructure – to accelerate incident detection and troubleshooting. Furthermore, with Wavefront’s ability to retain metrics long-term with no roll-ups, engineers can easily retain all their operational telemetry in a unified repository for long and perform trend analytics. For more information, please refer to the docs and check out our free trial.
Get Started with Wavefront Follow @chhavinij Follow @WavefrontHQThe post Wavefront Adds Dynatrace Integration: Providing First-Pane-of-Glass for Performance Analytics Across Full-Stack and APM Tools appeared first on Wavefront by VMware.
About the Author
Follow on Twitter More Content by Chhavi Nijhawan


