As an SRE deploying Wavefront as Enterprise Monitoring-as-a-Service across your organization, you may be asking: Is there a good way to see which metric time series are writing the most points? How can I check how many data points are emitted per metric into Wavefront? Is my cluster running efficiently?
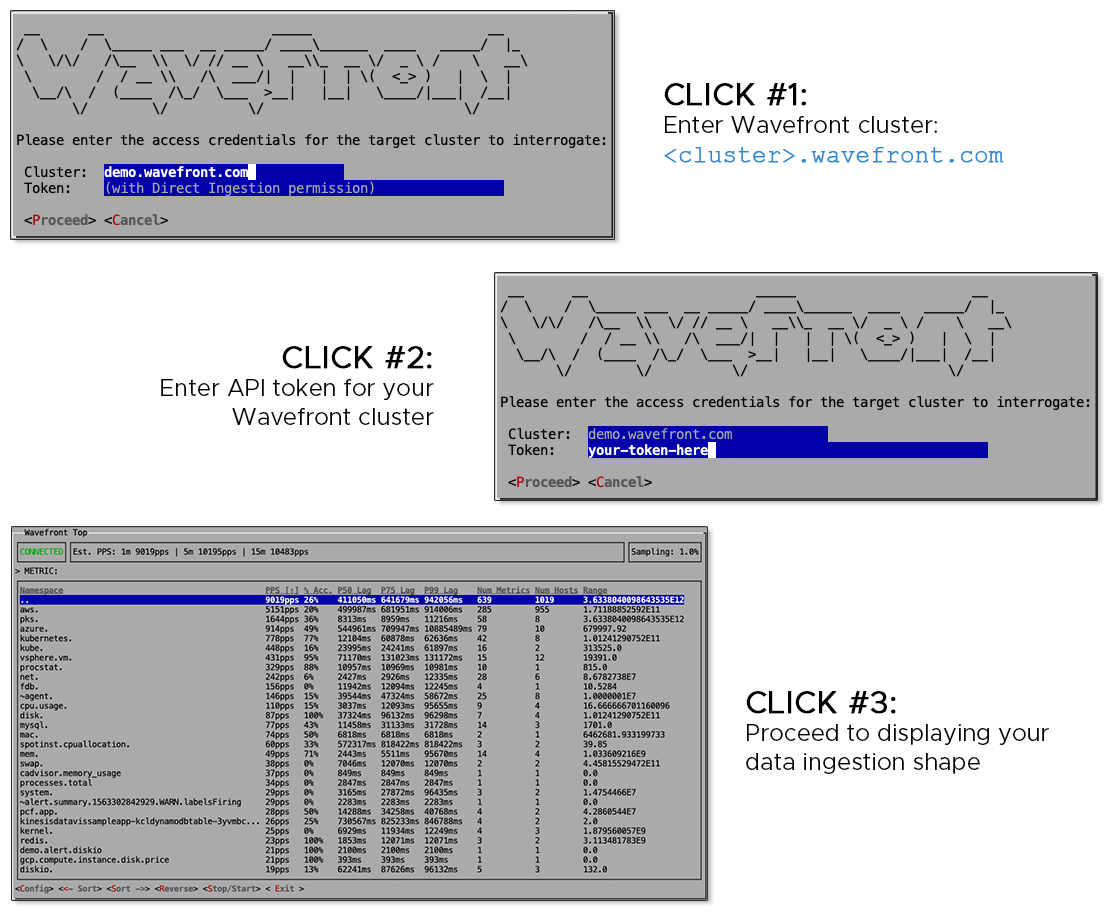
Customers using Wavefront often ask similar questions so they can assure efficiency and optimization of their monitoring as a service platform, particular at scale, such as when many teams use the platform to monitor their applications, services and environments. The new Wavefront Top tool provides fast answers to these questions, as fast as three clicks.
Just as Wavefront monitors the operational performance of your cloud environment, Wavefront Top monitors the ingestion operation of your Wavefront instance. With Wavefront Top, you can see which namespaces are sending high amounts of data to your Wavefront instance, group namespaces by ingestion source, or view newly created IDs. And if you’re acquainted with the Linux top command (which displays information on CPU and memory utilization), the structure of Wavefront Top will look familiar.
Wavefront is a SaaS-based, enterprise observability platform with the ability to visualize, alert and query data. You can use Wavefront to ingest time-series metrics, histograms, traces and spans logs. Data can be sent into Wavefront through integrations, a Wavefront proxy, or through direct ingestion.
 Log into the Wavefront Top tool in just three clicks to start viewing ingestion PPS or ID creations.
Wavefront Top is an open source tool to easily visualize the overall data ingestion shape into your Wavefront instance and quickly identify namespaces or sources with high points per second (PPS) and high lag time. Wavefront Top improves monitoring across your organization, allowing you to quickly discover which namespaces are sending a lot of data, calculate the percentage of “accessed” data, and view the range of values of namespaces. Data is considered “accessed” if queried in the last indicated number of days. Wavefront Top can also show the newly created IDs ingested by your Wavefront instance.
Wavefront Top uses the Wavefront Spy API to return information on the data points your instance is ingesting. When spying on points, Wavefront Top allows for sorting of multiple dimensions and offers grouping points by the ingested source. Searches can be narrowed down and queries can be adjusted from the Wavefront Top interface by typing a few characters. For newly allocated IDs, Wavefront Top returns the corresponding names of metrics, sources, point tags, histograms, span logs and user group.
With Wavefront Top, you now have an interactive way to view data that Spy API endpoints have returned, so you can quickly adjust parameters and sort namespaces.
 Wavefront Top’s Browse Screen allows for drill-down and selecting prefixes to build namespaces and visualize PPS, lag, number of metrics and hosts, and range of values.
Select namespaces to drill down and find the namespaces that are sending the most PPS. Wavefront Top supports sorting and reverse sorting based on columns. Configurations for spying on points and ID include sampling rate, separators, usage lookback, and more as follows:
 Wavefront Top simplifies the search for metrics’ points per second with or without group by ingestion source and assists in discovering new IDs that your Wavefront instance has ingested.
To see Wavefront Top in action, watch this video introducing Wavefront Top features:
To try a free trial of Wavefront or Schedule a Demo, contact our team here at Wavefront. Visit the Github page and let Wavefront Top help you optimize the monitoring of your Wavefront instance today.
Get Started with Wavefront Follow @joannatko Follow @WavefrontHQThe post Monitor and Optimize Data Ingestion by Wavefront Across Your Organization: Introducing Wavefront Top appeared first on Wavefront by VMware.
About the Author
More Content by Joanna Ko


