

For a demonstration of the solution discussed in this article, please see VKE Wavefront Integration video posted by Boskey Savla.
Monitoring is a cornerstone of the process of characterizing, analyzing, and optimizing applications. As an increasing number of applications either move to or are built atop container technologies, the challenges of monitoring these ephemeral workloads become a greater part of the operational burden for application developers and operators. Kubernetes is the focus of this blog due to the metrics which can be extracted from the platform itself, as well as its pervasive presence in the current container landscape.
Why Kubernetes?
Kubernetes is an open-source system for automating deployment, scaling, and management of containerized applications that was originally designed by Google and now maintained by the Cloud Native Computing Foundation. Between deployments from the open-source codebase as well as the commercial offerings based on that code, Kubernetes is becoming a dominant industry platform for containers in production. The items pertaining to extracting and analyzing metrics from the containers themselves may apply to other container ecosystems as well.
How is monitoring Kubernetes different?
Containerized systems such as Kubernetes environments present new monitoring challenges as compared to virtual machine–based, computing environments. These differences include:
• The ephemeral nature of containers
• An increasing density of objects, services, and metrics within a given node
• The focus moves to services, rather than machines
• The consumers of monitoring data have become more diverse
• Changes in the software development lifecycle
To address these factors, the sections below will focus on gathering metrics from two sets of sources. The first of these is the Kubernetes clusters themselves. In this way, information can be gathered which pertains to the arrangement and utilization of resources by the Kubernetes system(s) being monitored. Additionally, metrics gathered from the Kubernetes pods themselves will be discussed as well. These metrics will provide insight into how the services running within and between the individual containers are functioning. Both sets of data are required to gather a complete operational picture of a Kubernetes environment.
The solution proposed here for monitoring Kubernetes is a combination of multiple VMware Cloud services. Wavefront provides the metrics monitoring and alerting platform for both the Kubernetes cluster(s) and the application(s) deployed on them. The VMware Kubernetes Engine (VKE) service provides the Kubernetes clusters used to validate this approach.
VMware Kubernetes Engine
VKE is an enterprise-grade Kubernetes-as-a-Service offering in the VMware Cloud Services portfolio that provides easy to use, secure, cost-effective, and fully managed Kubernetes clusters. VKE enables users to run containerized applications without the cost and complexity of implementing and operating Kubernetes.
At the heart of VKE is the VMware Smart Cluster. The Smart Cluster automates the selection of computing resources to constantly optimize resource usage, provide high availability, and reduce cost. This construct removes the need for educated guesses around cluster definition and sizing for optimal compute resources. It also enables the management of cost-effective, scalable Kubernetes clusters that are optimized for application requirements. These clusters provide built-in high availability with multi-master deployment, routine health checks and self-healing capabilities for Kubernetes clusters. VKE allows users to run applications in a highly available environment without manual infrastructure configuration and maintenance.
What is Wavefront?
Wavefront is a software-as-a-service (SaaS) platform for ingesting, storing, visualizing, and alerting on metrics data. In this context, a metric is a quantitative measure of a defined property at a point in time, which is used to track health or performance. By this definition, all ingested metrics are comprised of a label, a numeric value, and a timestamp. Metrics can be ingested in the Wavefront data format as well as other standard and well–defined formats. Once within the system, metrics can be queried, charted, and used as the basis for alerts.
Gathering Kubernetes Metrics in Wavefront
Wavefront currently includes an integration for ingesting platform level metrics from a Kubernetes cluster and its components. These metrics can be gathered at various levels such as the cluster, node, pod, and individual container. In order to begin gathering these metrics, the first step is to deploy a Wavefront proxy in the Kubernetes cluster. This proxy is deployed as a Kubernetes ReplicationController, which is a construct designed to ensure that a specified number of pod replicas are running at a given time. A YAML file defining this proxy in a Kubernetes environment is defined on Wavefront’s Kubernetes integration setup page and can be located here. This definition can be used without any alterations on a newly created VKE cluster. After deploying the proxy, a service must be created in order for the proxy container to communicate with the Wavefront platform. The YAML definition can also be located on the integration’s setup page.
Finally, an instance of Heapster must be deployed as well in order to forward metrics from the Kubernetes cluster to the Wavefront proxy deployed previously. Heapster is a cluster-wide aggregator of monitoring and event data. It supports Kubernetes natively and works on all Kubernetes deployments. Heapster runs as a pod in the cluster, similar to how any other Kubernetes application would run. The Heapster YAML file contains a line of particular interest:
- --sink=wavefront:wavefront-proxy.default.svc.cluster.local:2878?clusterName=k8s-cluster&includeLabels=true
This line provides two important options; a chance to define a display name in Wavefront for the Kubernetes cluster being monitored, and the option to include Kubernetes labels as point tags on the metrics themselves. A prefix can also be added to the metrics forwarded by Heapster to aid in further differentiation and granularity when parsing the data in the Wavefront platform. This field could be used to signify a given line of business, project, application, or service. Details on the available deployment options can be found here.
Once this process has been completed, verify that metrics are being ingested by logging into Wavefront and navigating to the ‘Integrations’ page. From there, locate the ‘VMware Kubernetes Engine’ tile and click on it. Once on this screen, select the ‘Metrics’ view and a customer source (the clusterName value from the Wavefront proxy deployment). If the ‘Metrics Ingestion Rate PPS’ is positive, Wavefront is receiving metrics from the Kubernetes cluster.
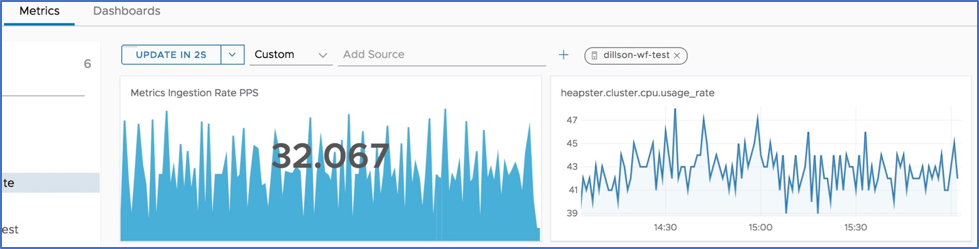
Figure 1. Validating that Wavefront is ingesting metrics from the specified VKE cluster
Ingesting Application Metrics from Containers
Once Kubernetes cluster metrics have begun to appear in Wavefront, the next step will be to gather metrics from the deployed Kubernetes objects. In this example, a sidecar methodology is used to forward application metrics from the Kubernetes containers within a pod to the in-cluster Wavefront proxy and eventually to the Wavefront cloud. A Pod may bound an application composed of multiple co-located containers that need to share resources. A sidecar container is one that enhances or extends the capability of an existing container and is deployed within the same Kubernetes pod. The Pod wraps these containers and their storage resources into a single entity. One of the reasons to use a sidecar type configuration is to avoid having to make any changes to the existing container images currently in use. The sidecar container (Telegraf is the Wavefront default for Kubernetes Integration) becomes a repeatable unit of YAML which can be reused across services with very minimal changes. This is depicted in figure 2 below.
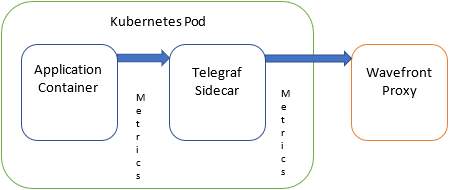
Figure 2. Kubernetes Pod with Sidecar and Wavefront Proxy
In this case, the Telegraf agent essentially acts as an intermediary between the deployed container (in this example a MySQL instance) and the Wavefront proxy. In the diagram below, the sidecar proxy essentially acts as the ‘Agent’ attached to a Host (Kubernetes pod). In Kubernetes, all containers belonging to the same pod share the same network namespace, so these sidecars will be easily addressable to the services they monitor.
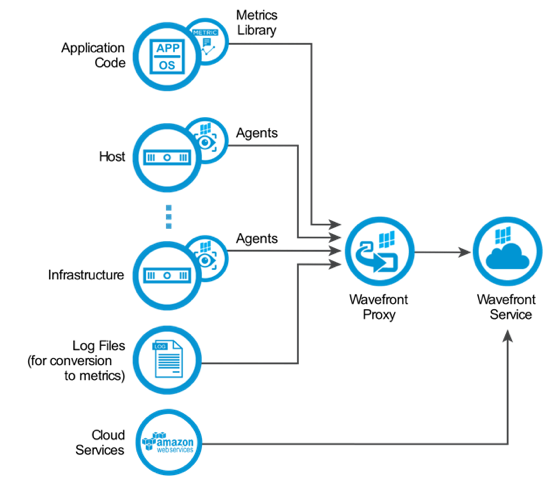
Figure 3. The Wavefront metrics ingestion pipeline
This is demonstrated in the Kubernetes YAML file below. In the YAML snippet, a portion of a configmap is defined and written into the mysql.conf configuration file. This configmap defines a set of metric and event data to collect from the MySQL instance running in this example container.
apiVersion: v1
kind: ConfigMap
metadata:
  name: telegraf-mysql-config
data:
  mysql.conf: |
  [[inputs.mysql]]
      servers = ["root:password@tcp(localhost:3306)/"]

      perf_events_statements_digest_text_limit        = 120
      perf_events_statements_limit                    = 250
      perf_events_statements_time_limit               = 86400

      table_schema_databases                          = []

      gather_process_list                             = true
      ...
The linkages and specific input and output parameters required developed for this example will be explored in detail in the second post on this topic. The sidecar container image is then configured to push metrics to the Wavefront proxy at a predictable DNS name within the cluster. This may be achieved by deploying the Wavefront proxy with a specific service name (i.e. wavefront-proxy) and in a distinct Kubernetes cluster namespace, such as ‘monitoring’ or ‘Wavefront’ to ensure consistency across clusters. Standard Kubernetes services are assigned a DNS A record for a name of the form my-svc.my-namespace.svc.cluster.local.
The benefit of using sidecar containers to monitor distributed applications on Kubernetes is that the monitoring configuration for your services will remain similar to the original application specification, so deployment is simple and sharing the same pod service discovery is straightforward and consistent.
This can be a challenge in Kubernetes environments because, with an aggregation collector(s), the deployed containers may change dynamically and unpredictably. Configuration can be difficult, but using this architecture, your application metrics will always be monitored, as demonstrated above in figure 1.
Conclusion
By following the methodology outlined above and utilizing Wavefront integrations for additional services, it is possible to ingest both Kubernetes system level and application level metrics into Wavefront via the same Wavefront proxy. This allows for the use of common cluster naming and prefix tagging to correlate and compare metrics from these categories in order to better understand the operation, health, and performance of applications deployed within a Kubernetes environment. Test it by starting your Wavefront free 30-day trial now.
Get Started with Wavefront Follow @dan_illson Follow @WavefrontHQ
Co-authors:
Bill Shetti
Bahubali is the Director of Public Cloud Solutions for VMware Cloud Services at VMware. He leads a team of Cloud Architects evangelizing and developing solutions for improving public cloud operations (AWS/Azure/GCP). Bahubali was part of the initial team that developed and launched VMware Cloud Services. Previous to VMware, was Director of Product Management at VCE (now Dell) for Cloud Management Products. Between 2011-2014, Bahubali lead operations at Cumulus Networks, led AWS cloud operations at several startups, and headed an open source routing software project. Between 2008-2010, Bahubali lead the cloud investment practice at Storm Ventures. He spent 9 years at Cisco in product management and business development. He holds a M.S. in Information Networking from Carnegie Mellon and a B.S. in Electrical Engineering from Rutgers Engineering.
Pierre Tessier
Pierre Tessier is a Staff Systems Engineer at Wavefront by VMware. He has worked on multiple extensions to the Wavefront platform, including a Telegraf output plugin and a Grafana data-source plugin. He’s a diehard sports fan, and enjoys any conversation that includes sports.
The post Monitoring VMware Kubernetes Engine and Application Metrics with Wavefront appeared first on Wavefront by VMware.


