

![]()
What Makes VMware Tanzu Observability by Wavefront Unique for AWS Monitoring
Real-Time, Graphical Visualization of Your Global AWS Resources
Enhanced VMware Tanzu Observability AWS dashboards show a rich graphical visualization of your AWS resources across the globe. With real-time, color-coded node-maps, SRE and DevOps teams can easily view their AWS resources across different regions and quickly find nodes that have exceeded any metric threshold.

Built-In Visibility into AWS Billing, Usage and Pricing Can Save You a Bundle
Tanzu Observability applies analytics to your real-time AWS resource consumption with detailed AWS pricing, to show you how to reduce your cloud costs – many customers have used this to save over $60K monthly!

Analytics-Driven Insights into AWS, Performance and Utilization, Enables You to Make Data-Driven Decisions
Tanzu Observability provides analytics-driven, prebuilt dashboards to monitor key AWS services including EC2, EBS, EKS, Kinesis Firehose, CloudFront, CloudTrail, Lambda, ELB, DynamoDB, Redshift and many more. These insights equip you to make data-driven decisions for things like AWS capacity planning and resource optimization.

Unified, Full-Stack AWS Monitoring That Reduces MTTR
See how easy it is for Tanzu Observability to pull together metrics from applications, infrastructure and different AWS services (including CloudWatch, CloudTrail and other AWS APIs) providing unified, full-stack metrics view that significantly reduces MTTR.

30+ Built-in Dashboards for Different Amazon Services Providing Out-of-the-box Visibility into AWS
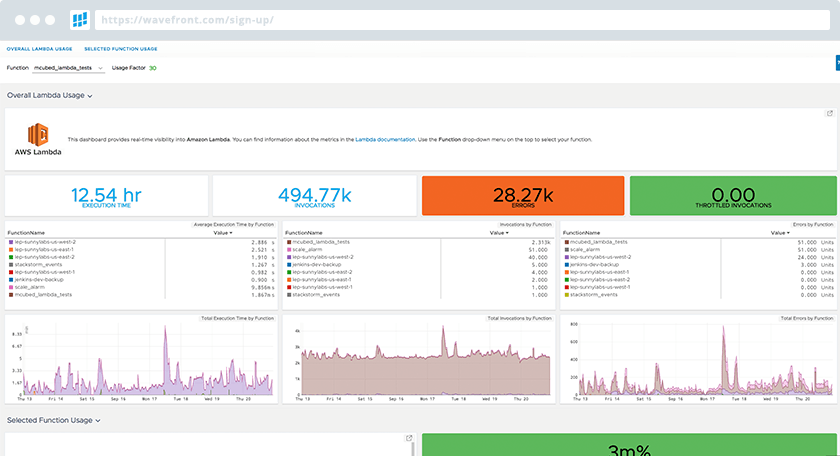
AWS Lambda
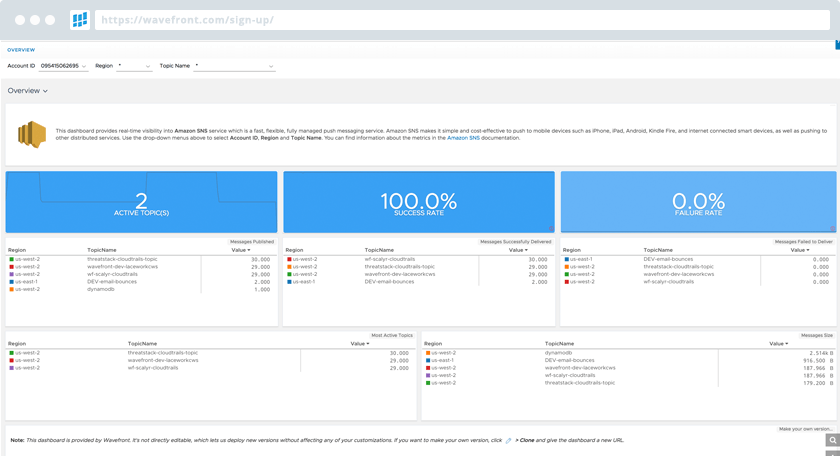
Amazon SNS
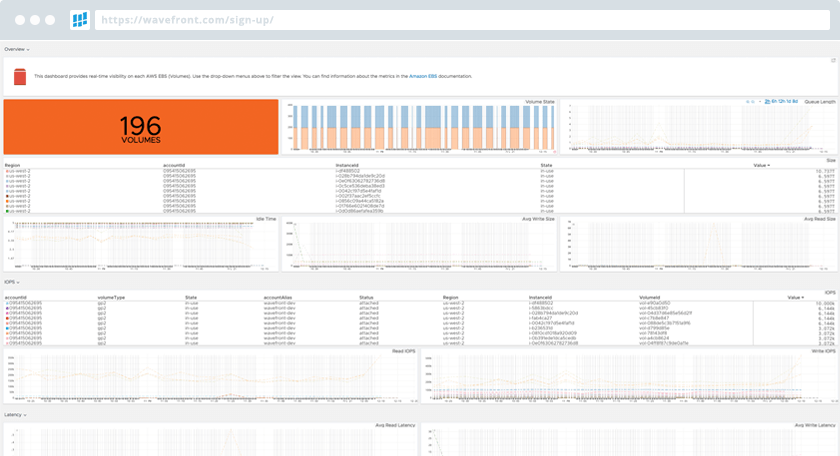
Amazon EBS
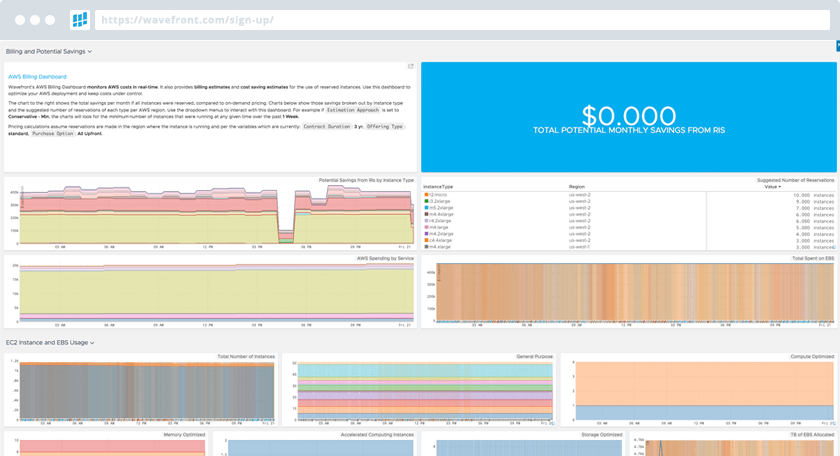
AWS Billing
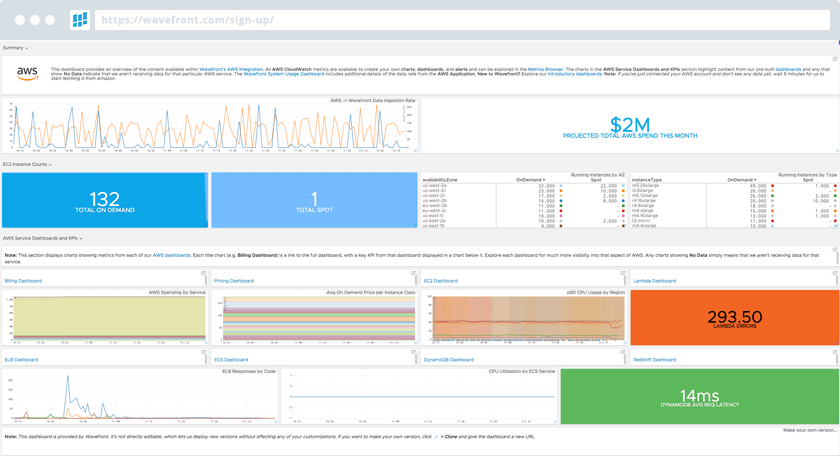
AWS Summary
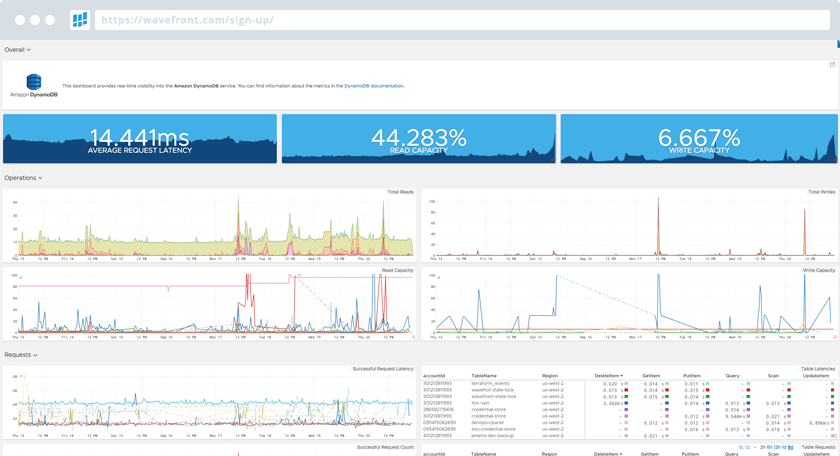
Amazon DynamoDB

How to Scale your SaaS with Public Cloud Analytics
In the dynamic world of public clouds with many services, scaling your cloud-native applications can be challenging. When choosing a monitoring platform for their cloud applications, DevOps and developer teams must look for characteristics that reflect the nature of running code on a public cloud: speed, flexibility, and scalability.
Download eBook
Full-Stack Monitoring with 220+ Integrations


“Wavefront is a better overall alternative to open source observability, and there’s an awful lot to be said for the “single pane of glass” approach, with all of our metrics and alerting in one place. With a source-agnostic and well-documented data format, it’s trivial to make anything that produces metrics talk to Wavefront, and immediately get visibility, alerting, and sophisticated analytics on that data.” - Rob Fisher, Site Reliability Engineer, Centrica Hive


