

Micrometer is a metrics integration library for developers who want add metrics to their code with a vendor neutral API. A general-purpose Java library, its aim is to become a standard metrics library compatible with many popular analytics and monitoring solutions while keeping it lightweight and easy to use. Another cool thing about it is, starting with Spring Boot 2.0, Micrometer is the instrumentation library powering the delivery of application metrics from Spring (by Pivotal). Support is ported back to Boot 1.x through additional library dependency.
Recently, Micrometer added support for the Wavefront metric registry which produces metrics data in the Wavefront data format. The library gives a choice of sending data (a) to the Wavefront proxy or (b) to the Wavefront API directly. Before Micrometer, the most popular Java library for developers to generate application specific metrics was DropWizard, which itself is a complete framework for generating Dropwizard Metrics within your own Java application code. However, with the release of Micrometer and its close ties with the Spring, integrating Wavefront with Java applications has gained a wider audience. Moreover, Micrometer is not dependent on the Spring framework (although it’s quite friendly with it), and can also be used in other frameworks like J2EE, or just simply within a standalone Java application.
You can find more details about how Micrometer works in Micrometer’s documentation. In this blog, I focus on how to use the Micrometer library to start generating your own application-specific metrics to Wavefront in just a few minutes. Note that I assume you have a basic understanding of Java programming, DevOps principles and build automation tools like Maven and Gradle.
What are application-specific metrics?
Metrics can come from a variety of data sources including system resources such as CPU, memory, network, and storage. They are useful for continuous monitoring and keeping track of how resources are being utilized by your applications, especially when aggregated in large numbers over multiple environments. However, aside from the usual measurements of how cloud or on-premises systems are running, there are metrics that are custom to specific applications such as business KPIs, call counts to a given service or transaction, error counts, or security-related event counts. An easy way to capture context-sensitive metrics is with code instrumentation.
Having both generic system metrics and application specific metrics in the same monitoring system greatly enhances the ability to discover and correlate the abnormal behaviors, making any troubleshooting work a lot more efficient. You can now easily see casual relationships of one to another, and see whether certain metrics are impacted by others. For example, you can validate that network performance wasn’t the cause of a recent surge of error rates, but rather a bug in the application code, or the recent drop of server response rates, was the smoking gun of a degradation of database performance.
Using Micrometer to collect application metrics
Let’s start with a very simple Java application which starts, runs indefinitely, and produces random numbers. Let’s pretend that these random numbers are certain key business performance indicator, and let’s collect that using Micrometer, and send them over to Wavefront. Here is the code for this simple Java application:
SampleApplication.java
import java.util.Random;

public class SimpleApplication extends Thread {
    public static void main(String[] args) {
        SimpleApplication app = new SimpleApplication();
        try {
            app.start();
        }
        catch(Exception e) {
            e.printStackTrace();
        }
    }

    @Override
    public void run() {
        int seq = 0;
        while(true) {
            // generate a random number, from 0 to 100
            Random r = new Random();
            int num = r.nextInt(101);
            System.out.println("Measurement seq " + seq + " : " + num);
            seq++;
            try {
                sleep(1000);
            }
            catch(Exception e) {
                e.printStackTrace();
            }
        }
    }
}
The resulting output in standard out would look something like this, where it outputs randomly generated numbers between 0 to 100.
Output
Measurement seq 0 : 37
Measurement seq 1 : 88
Measurement seq 2 : 20
Measurement seq 3 : 15
Measurement seq 4 : 9
Measurement seq 5 : 10
Measurement seq 6 : 63
Measurement seq 7 : 62
Measurement seq 8 : 100
Measurement seq 9 : 33
Measurement seq 10 : 49
Measurement seq 11 : 74
Measurement seq 12 : 87
Measurement seq 13 : 49
Measurement seq 14 : 11
Measurement seq 15 : 10
Measurement seq 16 : 92
Measurement seq 17 : 25
Measurement seq 18 : 99
Measurement seq 19 : 66
Measurement seq 20 : 57
Measurement seq 21 : 64
Measurement seq 22 : 6
….
Getting the Micrometer library
The Micrometer library can easily be imported either through Maven projects or Gradle. Simply create or convert your existing Java project into Maven or Gradle project, and add the following entry into your POM.xml or build.gradle file.
POM.xml
<dependency>
  <groupId>io.micrometer</groupId>
  <artifactId>micrometer-registry-wavefront</artifactId>
  <version>LATEST</version>
</dependency>
build.gradle
compile 'io.micrometer:micrometer-registry-wavefront:latest.release'Maven or Gradle will then download and install the library as well as required dependencies automatically.
Injecting Micrometer code
Now, let’s modify our existing code to produce metrics for Wavefront. Basically, everything with Micrometer starts when you create a registry, which is the main object for creating and keeping track of metrics and their values. Micrometer provides Wavefront a specific registry, so we are going to be using that. We will keep most of the settings by default, except the host and port number of the Wavefront proxy that the registry is going to send metrics to. Let’s look at the following modification to our SampleApplication.java:
SampleApplication.java v2
Import io.micrometer.core.instrument.Clock;
import io.micrometer.core.instrument.MeterRegistry;
import io.micrometer.wavefront.WavefrontConfig;
import io.micrometer.wavefront.WavefrontMeterRegistry;
import java.time.Duration;
import java.util.Random;
import java.util.concurrent.atomic.AtomicInteger;

public class SimpleApplication extends Thread {
    public static void main(String[] args) {
        SimpleApplication app = new SimpleApplication();
        try {
            app.start();
        }
        catch(Exception e) {
            e.printStackTrace();
        }
    }

    WavefrontConfig config = null;
    MeterRegistry registry = null;
    AtomicInteger resource = null;
    public SimpleApplication() {
        // setup metric configuration
        config = new WavefrontConfig() {
            @Override
            public String uri() {
                return "proxy://localhost:2878";
            }

            @Override
            public String source() {
                return "test.source";
            }

            @Override
            public String get(String key) {
                // defaults everything else
                return null;
            }

            @Override
            public Duration step() {
                // 10 seconds reporting interval
                return Duration.ofSeconds(10);
            }

            @Override
            public String prefix() {
                return "wavefront";
            }
        };
        // create a new registry
        registry = new WavefrontMeterRegistry(config, Clock.SYSTEM);
        // create a new gauge and resource value
        resource = registry.gauge("myapp.resource", new AtomicInteger(0));
    }

    @Override
    public void run() {
        int seq = 0;
        while(true) {
            // generate a random number, from 0 to 100
            Random r = new Random();
            int num = r.nextInt(101);
            // update the resource value
            resource.set(num);
            System.out.println("Measurement seq " + seq + " : " + num);
            seq++;

            try {
                sleep(1000);
            }
            catch(Exception e) {
                e.printStackTrace();
            }
        }
    }
}
Running and monitoring
Now, the instrumentation code to produce a single gauge type of “myapp.resource” is created, and once registered into the registry, the WavefrontMeterRegistry object will submit whatever the gauge value was at the time of 10-second intervals. This assumes that you have a running Wavefront proxy at localhost:2878.
Notice that even though the application is diligently recording the value every 1 second, the actual value that is sent by Micrometer is the value at the time the reporter reports (which is every 10 seconds), and this may introduce some data not ending up in Wavefront. But that’s normal, and there are ways to capture those metrics data in various ways using other meter types like Timer, Histograms, Distribution Summaries, or even reducing the reporting time down from 10 seconds to 1 second. More information on those different types are described in Micrometer’s concept documentation.
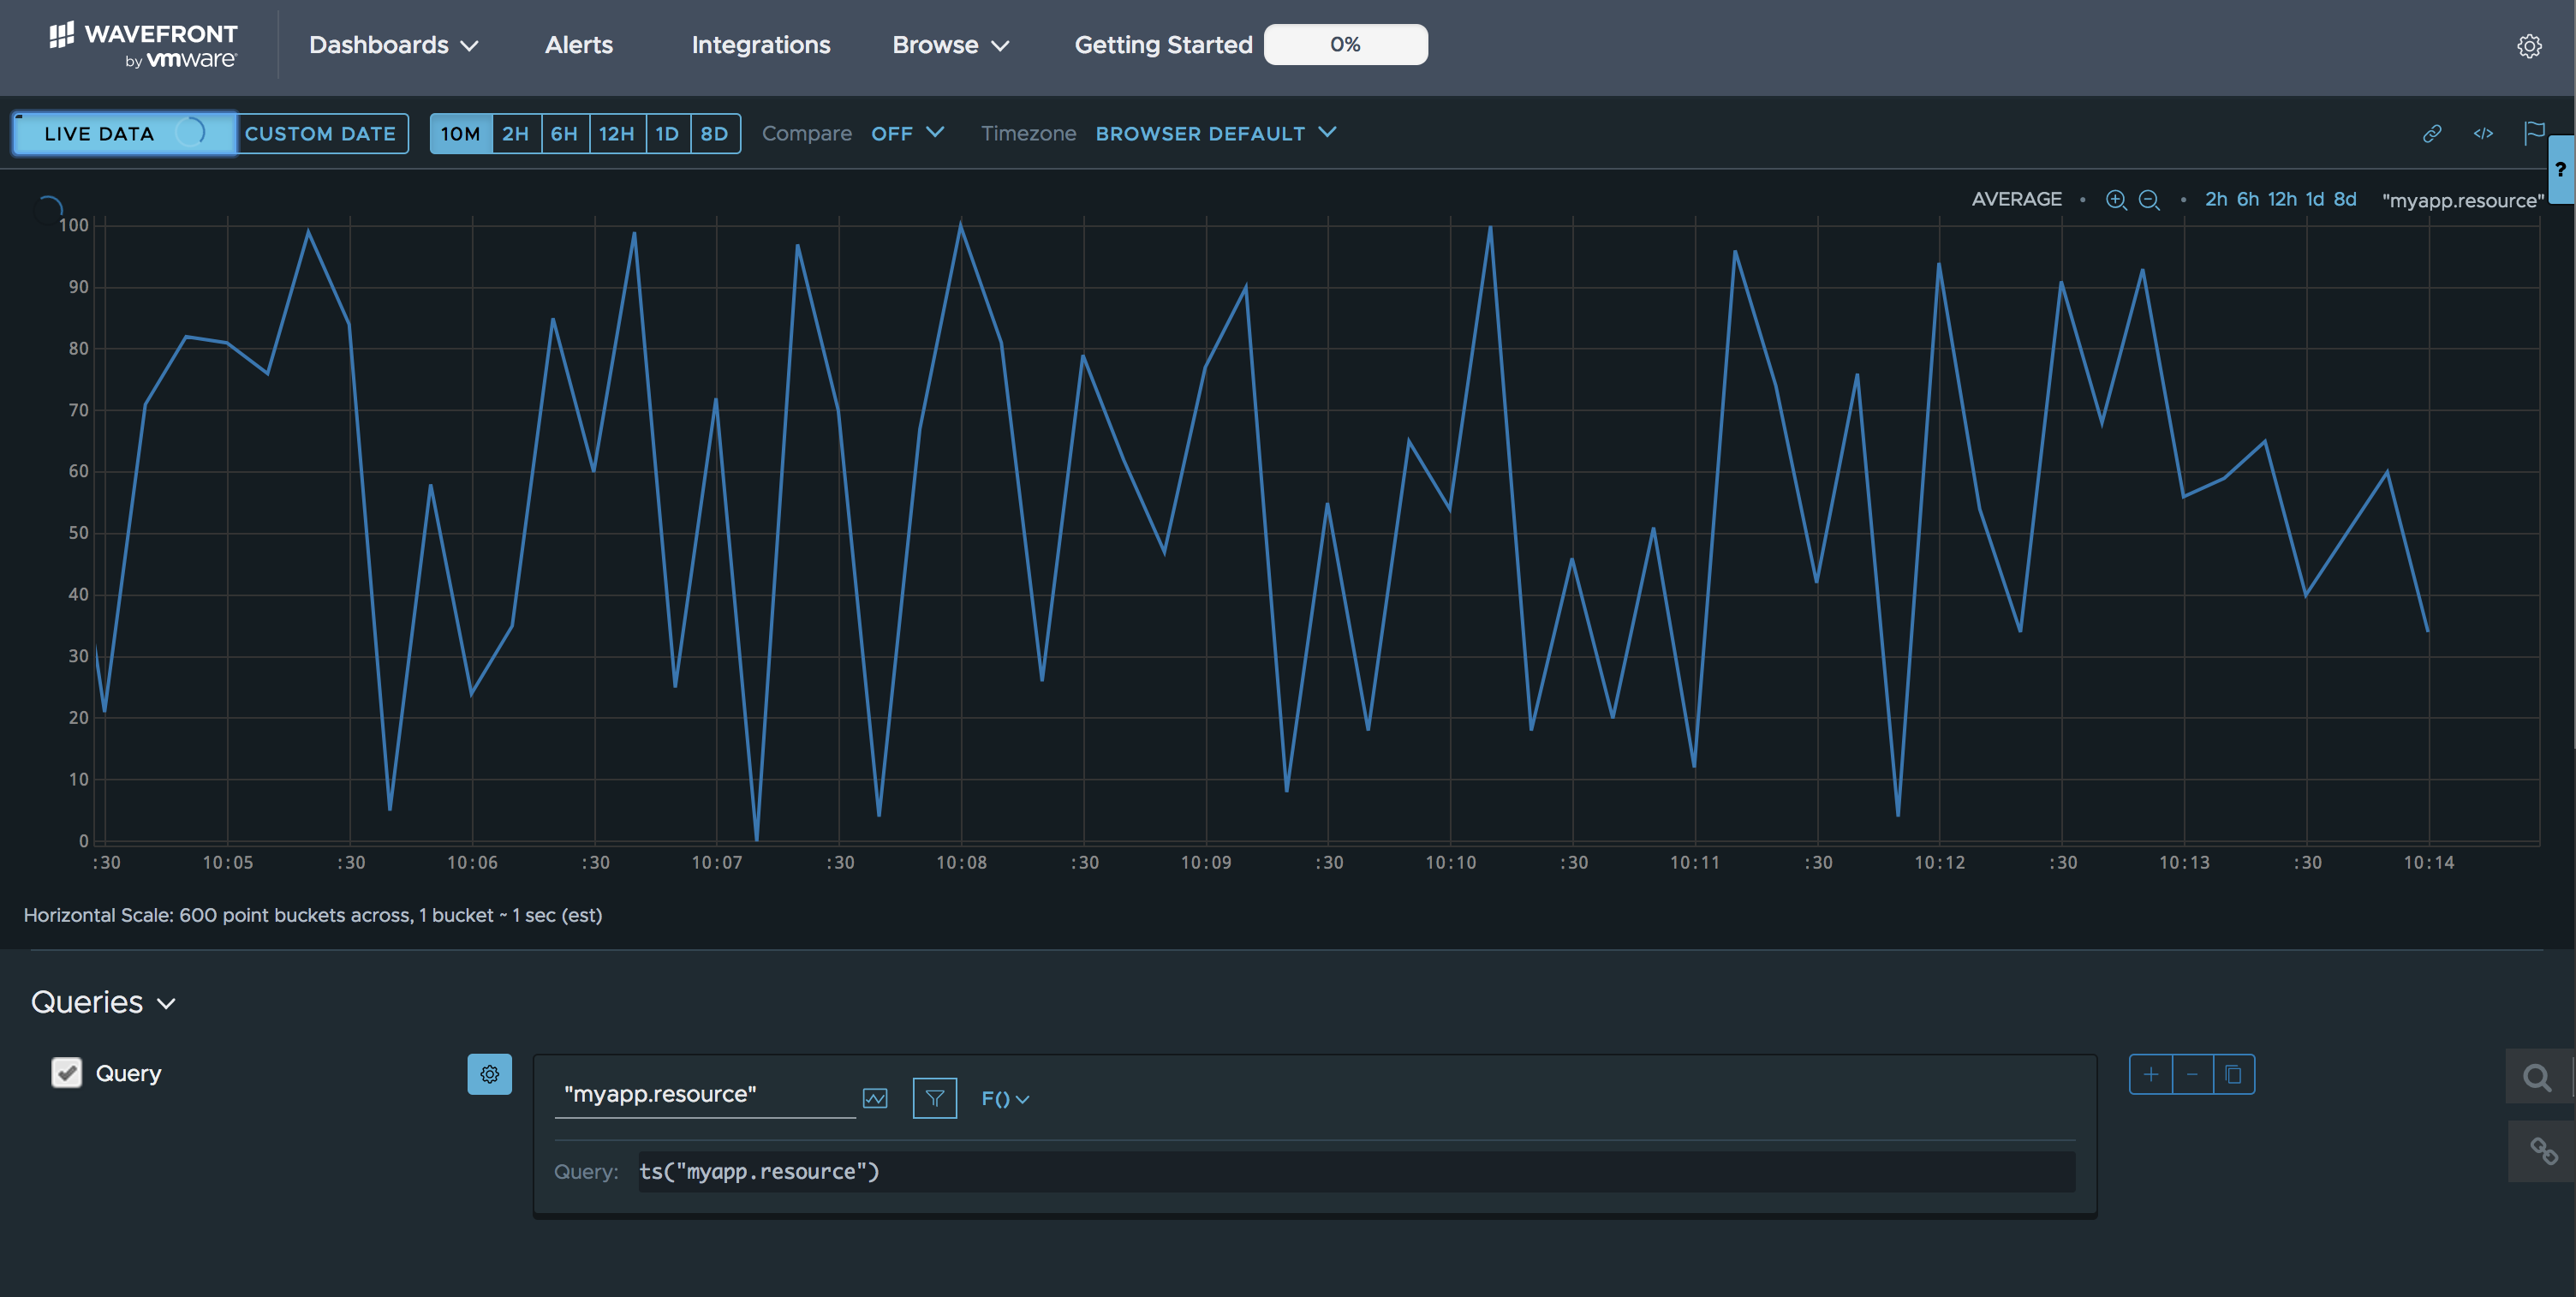
Monitoring your metrics using Wavefront
Now that you have your metrics, you can pretty much do anything that you wish to do using the Wavefront Query Language with its 100+ analytics functions, and its easy-to-customize charting and dashboarding functionalities. You can then overlay other system metrics like JVM metrics, and bind them to your existing registry:
// create a new registry

registry = new WavefrontMeterRegistry(config, Clock.SYSTEM);

// create a new gauge and resource value

resource = registry.gauge("myapp.resource", new AtomicInteger(0));

new ClassLoaderMetrics().bindTo(registry);

new JvmMemoryMetrics().bindTo(registry);

new JvmGcMetrics().bindTo(registry);

new ProcessorMetrics().bindTo(registry);

new JvmThreadMetrics().bindTo(registry);
Wavefront Micrometer: micro-effort, but macro-powerful
To summarize, instrumenting application specific metrics has gotten much easier and quicker using platform-neutral metrics library like Micrometer. Then when it’s combined with a SaaS-based metrics monitoring and analytics platform like Wavefront, it takes only a matter of minutes to set everything up and immediately start sending metrics and visualizing them.

Not only that, even though it wasn’t extensively covered in this blog, there are many powerful ways to make your metrics even more useful using the power of Wavefront’s analytics. I hope you found this blog useful. And if you want to experiment with Micrometer and Wavefront further, you can in our free trial.
Get Started with Wavefront Follow @YooHoward Follow @WavefrontHQThe post Wavefront Micrometer Integration Delivers Maximum Application Visibility with ‘Micro’ Effort appeared first on Wavefront by VMware.


