

Nagios monitors IT infrastructure components including servers, network devices, operating systems, and application sub-systems.
First launched in 1999, Nagios has community-provided plugins for monitoring a large set of components. It has grown to become the near de facto way to do basic monitoring and “checks” (simple alerts) of servers and networks.
However, most users of Nagios will agree that:
- It’s very hard to scale for a large modern cloud application infrastructure and particularly as micro services are used.
- Checks are slow and expensive to run, which is why many users supporting larger estates do them no more than every 5 minutes.
- Tech Ops is often drowned in alert storms, which quickly lead to alert fatigue and people ignoring Nagios.
- It has the potential to be easily broken, if you don’t know what you’re doing.
- Configurations can quickly get messy, if not carefully managed.
- Its web user interface is complicated and hard to understand for new users.
If you’ve encountered any of the issues listed above, then I suggest the time is now for a different mindset in how to monitor and alert on your cloud application environment.
Specifically, rather than setting an alert condition based on a discrete metric value at a single point-in-time, set it based on analytics over a time-series of metric values with Wavefront.
In this later approach, Wavefront evaluates a stream of continuous values and then applies a meaningful combination of analytics functions to determine an alert condition.
This time-series and analytics-based approach enables far more intelligent alerts – e.g. based on dynamic baselines – as well as far more efficient management of all the alerts watching over your estate.
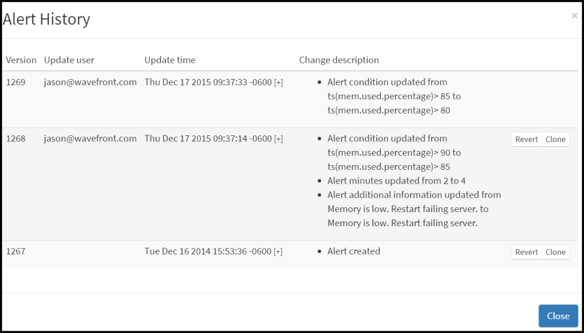
Figure 1. Wavefront makes it easy to manage and maintain hundreds of alerts across your entire stack, administered by each team’s alerts or by all the alerts in aggregate.
A key advantage of Wavefront over Nagios is that, with Wavefront, the analytics for defining an alert condition resides in its backend and you fully control the analytics logic.
With Nagios, the alert condition logic is in its plugin which can be error prone and hard to get right. This also means that when you make changes to your production environment, you may likely need to rewrite the particular Nagios plugin, while with Wavefront, you can easily update the alert from its simple, alert management web portal (and back-test the updated alert on historical data!).

Figure 2. Use Wavefront’s Backtesting feature to see how often your new alert would have fired on historical data, increasing alert quality before it’s rolled into production.
How do we go about doing it with Wavefront
To illustrate with a very simple example, we’re going to monitor disk space across multiple server instances.
We’ll be collecting disk space related metrics using collectd, however, the logic to alert when the free disk space threshold crosses is done within the Wavefront cloud service for all the server instances.
The advantage with this collectd approach is that the collectd.conf file never changes and you’re less prone to a configuration error as your software changes.
Creating alerts in Wavefront is extremely easy. We use a simple but powerful query language to notify when the time-series metric stream for free disk space, ‘df.available’, falls below 1G.
Additionally, we can further filter and refine the alert using tags (which provide additional metadata about the time-series metric). We then check only for hosts which have the “prod” tag and the file system type, “ext4”.
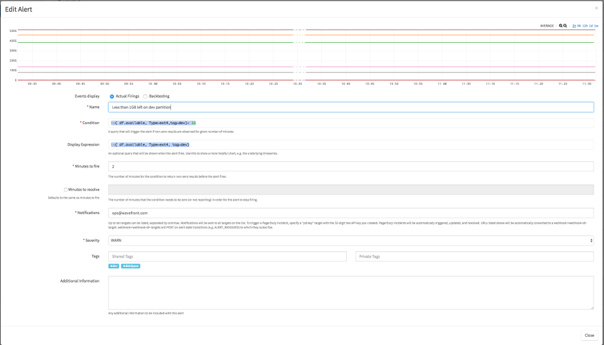
Figure 3. Wavefront alerts are analytics-driven, and any query can be converted into an alert from a chart. Analytics-driven alerts reduce false positives and false negatives.
As you see on the screen above, from a single, web portal, we’re able to specify alert logic that can be replicated to multiple instances, making it easy to scale alerts as the environment grows and as the software disk profile changes.
As you’d also expect, Wavefront alerts can be forwarded to a variety of other systems, from email to tools like PagerDuty for on-call notification, or via Webhooks, to practically any other system that processes alerts.
Final thoughts: think augment-&-extend when rip-&-replace isn’t practical
For most of our customers, it isn’t practical to simply rip out Nagios and replace it with Wavefront. Instead, Wavefront is deployed on top of Nagios, and the tools co-exist for some time.
By augmenting the legacy Nagios installation – Wavefront ingests the Nagios metrics – Wavefront then extends monitoring and alerting to the new parts of the environment.
This “augment-&-extend” approach gives Tech Ops teams all the time they need to migrate off Nagios methodically, plus start to get the immediate value of Wavefront.
Wavefront helps you scale with more intelligent, analytics-driven alerts that reduce alert fatigue, alerting on the things that matter and need immediate action.
Its architecture enables alerting to scale across enterprise environments, while its alert management capabilities help you to consolidate more of your alerting onto a single platform, making it easier to maintain as your cloud applications grow.
If you’re currently using Nagios, and you’re interested in a different and better way to do alerting, then talk to us. We can set you up with a Wavefront trial account immediately. You’re only a few minutes away from intelligent alerting that will make you look smarter too. 
The post Replacing Nagios Checks with Wavefront Intelligent Alerting appeared first on Wavefront by VMware.


