

Have you ever taken a taxi in the Arab world? Specifying a postcode won’t help you much. Instead you have to provide a more detailed description of the location where you want to head to, for example, the supermarket next to the post office or the fourth house around X roundabout. Imagine being a logistic company operating in this part of the world trying to deliver packages. Operationalizing can get quite tricky without postcodes and relying on location descriptions instead.
(The data science described in this post and the post itself is joint work by Pivotal Data Scientists Dat Tran and Megha Agarwal.)

A Pivotal client was having a similar problem. The company is one of the largest logistics providers in the Middle East. They resorted to making a phone call to each customer to confirm their address before delivering the shipment. The entire process was quite painful and expensive. In this article, we discuss how the Pivotal Data Science EMEA team helped this client avoid making these calls by inferring the delivery location using data, helping them save millions of dollars in the process.
Data Science Workflow
The goal of the project was to reduce and finally avoid the phone calls the client made to confirm customers’ delivery addresses. The descriptions of the delivery locations were stored as free text field. Unfortunately, the client was using this as an update table, i.e. the previous delivery address is overwritten every time a customer updates its address. This meant that we couldn’t use these location descriptions for our project. We helped the client restructure their logic to store all the location descriptions instead so that this information can be used in the future.
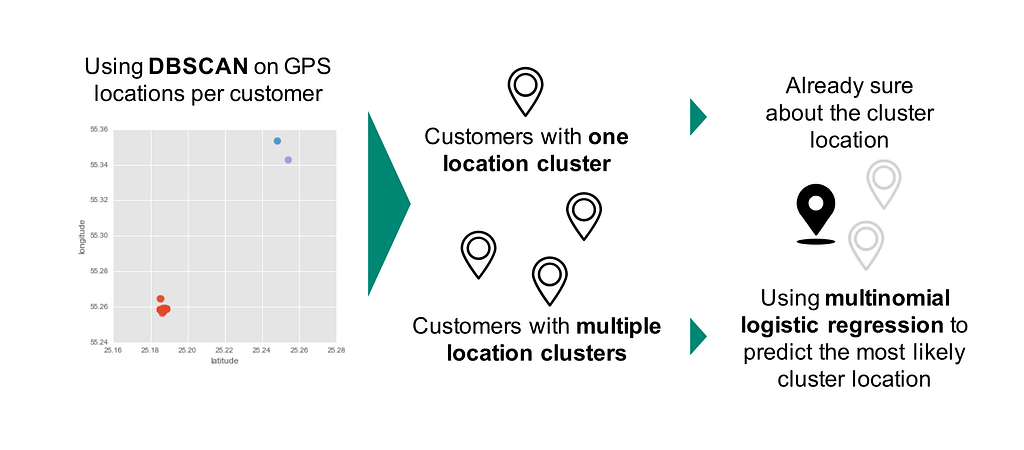
Fortunately, the client’s delivery people record the GPS data (latitude and longitude) every time they deliver a shipment. The GPS coordinates recorded for the same location could vary by a few kilometers. Based on the historical delivery locations, we built personalized models for each customer to predict the delivery location of the shipment in consideration. For each customer, we started by clustering all the GPS coordinates within few kilometers to create unique location clusters. We used DBSCAN for clustering as shown in Figure 1. DBSCAN is a density based clustering algorithm. Once given a set of points in some space, it groups together points that are closely packaged together.
Once we had clustered the delivery locations, most customers either had one or multiple location clusters based on past deliveries. In cases where the customer had one location cluster, we would use the center of the clustered location for the delivery. We associated a level of trust to the location cluster based on a threshold formulated from the number of shipments delivered to a location.
Some customers also received deliveries in distant locations. In these cases, DBSCAN would create multiple location clusters. Then we needed to predict the most likely location cluster for delivery. We looked at various shipment characteristics to help us identify the location cluster. Our intuition behind this was that if a customer always gets their groceries delivered to the home address and the bank statements to the work address, the next time a delivery is made from TESCO’s, it is most likely to be delivered to the home address. We tried several classification models. In the end, multinomial logistic regression was used for multiple location clusters and binary logistic regression was used for exactly two location clusters. The client also wanted to understand the driving features behind the predicted locations instead of having a black-box model like neural networks.
Technology Stack
When we started with this project, data was scattered across different parts of the company. The first step was to centralize the data. With the help of Spring XD, our data engineers ingested the data from various client sources to a Hadoop-based data lake. Besides being a central repository, the data lake also helps the client collect and store more data (structured and unstructured) from various applications in raw format. Figure 2 shows the complete technology stack we used.
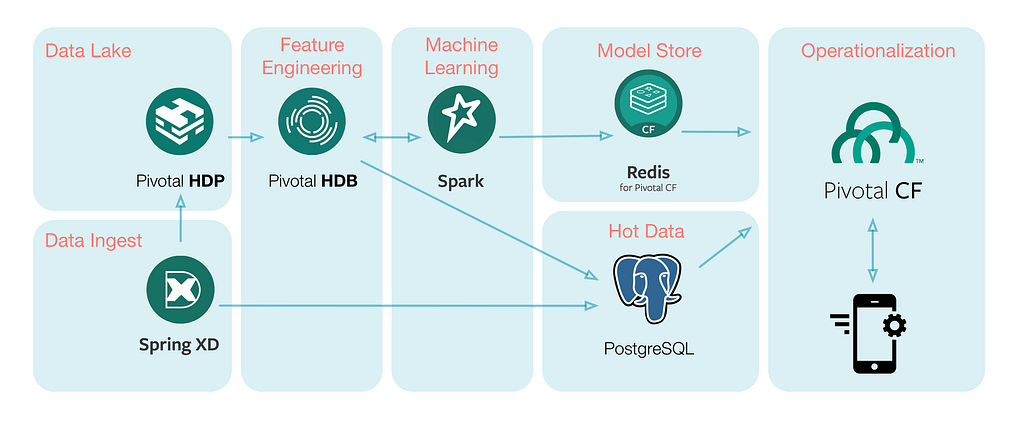
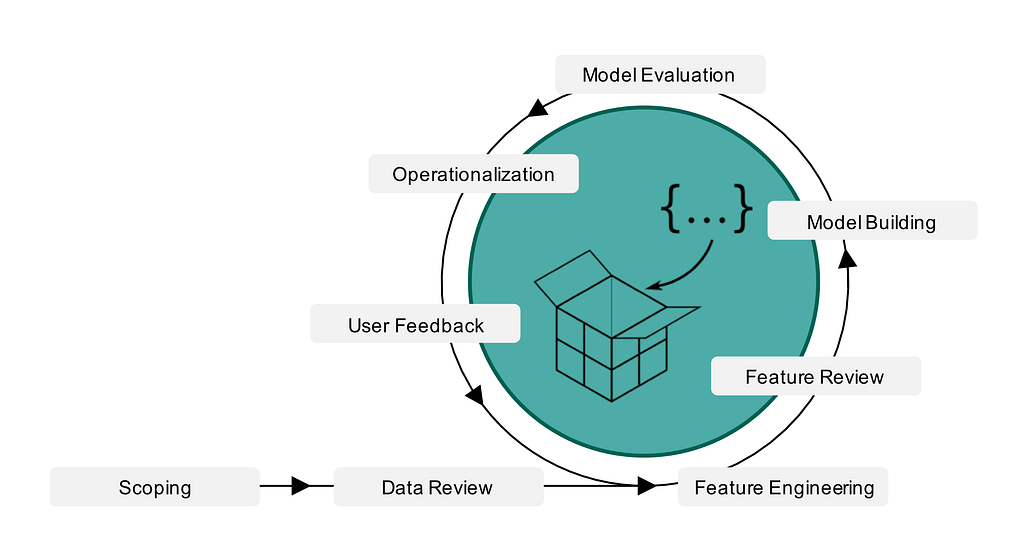
Once the data lake was in place we started playing around with the data. As mentioned in our previous blog post, we usually start with data exploration followed by operationalizing the model in production. In the exploration phase, we interact with the data iteratively to understand and clean the data, develop meaningful features, experiment and evaluate relevant statistical models. We used Pivotal HDB, the Hadoop-native SQL database powered by Apache HAWQ, to interact with the data lake. We try to iterate through the cycle quickly (Figure 3) and with HDB we could simply write SQL queries to understand and clean data (in order of terabytes) followed by feature engineering.
Alternatively, we could have used SparkSQL to process such a large amount of data. However, the main advantage of HDB is that it uses a variant of PostgreSQL (PSQL) and therefore includes many benefits such as the rich PSQL syntax, PL/X functions and many more. Another big plus is its vast support for multiple data file formats including Apache Parquet and HDB binary data files, plus HBase and Avro via the Pivotal Extension Framework (PXF) services.
For the machine learning part, we used PySpark, Apache Spark’s Python API. Python 3 can be used seamlessly through Spark’s Python API. Test driven development becomes much easier in PySpark than in SQL. However this does mean tuning various configuration settings (number of executors, partitions, caching, CPU and RAM, etc.) to get the desired optimal computational performance.
Once we figured out the model that worked best for our use case, we followed an API first approach to expose the predictions of the data science model in the form of an API endpoint. Our client could test it and provide us early feedback. In the production phase, we strictly test-drive our code. We store our models in Redis. The API lives in Pivotal Cloud Foundry (PCF) so the client can easily scale the application and run it on a private cloud, which was crucial for our client as they had sensitive customer data. We introduced a hot data storage layer, Postgres running as service within PCF, where we stored the most recent transaction data along with some summarized data required by the API so that the app don’t have to hit the data lake every time it makes a request.
Conclusion
We helped our client automate the delivery location confirmation process in a short amount of time. We used an API first approach to expose the insights derived from our data models to drive actions in real time. It helped put our model in production quickly with a faster feedback loop.
If you are interested in learning more, or would like Pivotal Labs and our data science team to help you jumpstart your project, please get in touch.
Twitter @datitran / @agarwal22megha.
Related Reads
- API First For Data Science
- Test-Driven Development for Data Science
- Other articles from Pivotal Data Scientists
- Read more about Pivotal HDB
- Check out the product info, downloads, and documentation for Pivotal Cloud Foundry
Delivery in a Land with No Postcodes was originally published in Actionable Data on Medium, where people are continuing the conversation by highlighting and responding to this story.
About the Author
Follow on Twitter Follow on Linkedin Visit Website


