

“There’s amazing people doing amazing things, thinking about amazing solutions, and I think as storytellers, it’s important for us to lean into some of these futures. They don’t have to be perfect futures, but they’re futures where there’s hope. The framing device in ‘Postcard from Earth’ is deep, deep future, but at least it’s an idea that’s pointing to something where people got their [stuff] together and save the planet.” Darren Aronofsky on ‘Postcard From Earth.’
While attending my second AWS re:Invent in November 2023, several colleagues and I were able to attend a screening of Darren Aronofsky’s ‘Postcard From Earth’ at the Las Vegas Sphere. Aronofsky’s immersive story is one of new hope and a future, but at the ultimate expense of Earth. In the end, the human race must leave earth to find a new home.

But how does Earth get to the point where the human race would need to evacuate? We witnessed the human race continue to advance and grow no matter what the cost. When we think of cost, most people dwell on the dollars and cents. However, this cost ended up being more than what could be counted in someone’s wallet or bank account. This cost was that the human race neglected to take care of the home they loved and, ultimately, lost it entirely.
Tanzu CloudHealth & GreenOps
Historically, Tanzu CloudHealth has been leveraged by customers around the world to manage cost in the most traditional sense. On January 25, 2024, Tanzu CloudHealth released its own “amazing solution” to try and help “save the planet” from the ultimate cost. That solution is GreenOps. In a partnership with AWS and WattTime, Tanzu CloudHealth is working to cultivate a culture of sustainability. GreenOps was developed as a tool for us to not neglect the home we love with the goal of visibility into carbon emissions generated by using the public cloud and to provide recommendations for rightsizing cloud infrastructure to be more energy efficient.
Leveraging the Tanzu CloudHealth GreenOps solution, customers will receive visibility, optimization, and governance over their cloud carbon emissions.
Visibility: Businesses can view data, share dashboards, and report on carbon emissions (CO2e), power consumption (megawatt hours), and carbon intensity per region (metric tons of CO2e), across cloud environments.
Optimization: Tanzu CloudHealth is bringing emissions savings metrics into our rightsizing recommendations, so businesses can easily consider trade-offs between workload cost, performance, and environmental impact when rightsizing infrastructure.
Governance & Automation: With a built-in policy engine, Tanzu CloudHealth enables businesses to start and stop cloud instances at appropriate times, reducing the total power consumption, and thus reducing carbon emissions.
The Cloud & Carbon Emissions
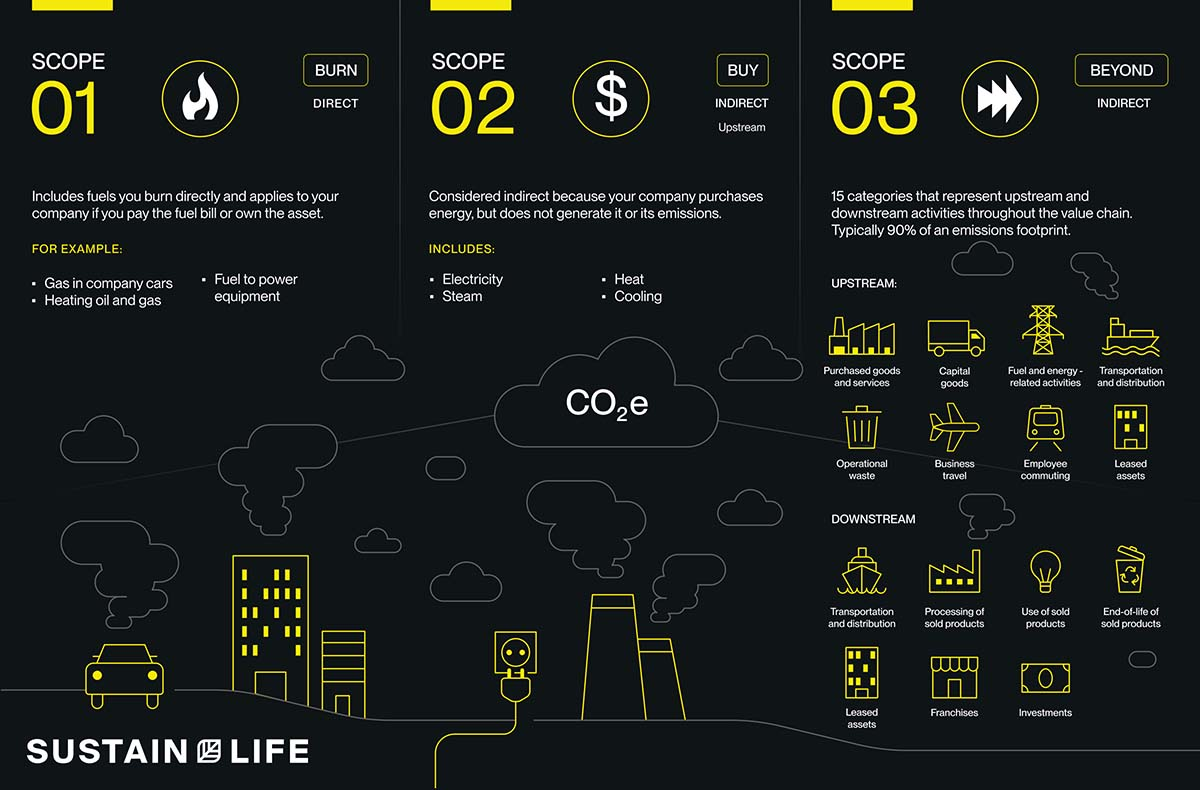
Before diving into how managing GreenOps inside of Tanzu CloudHealth looks, we need to step back and take a look at what carbon emissions look like when tied to cloud usage. Carbon emissions are broken into 3 different categories or “Scopes.” Each scope is a specific piece of the supply chain.
Scope 1 refers to direct emissions from sources that are owned or controlled by the company. This scope includes things like fuel that was directly burned by the company. Some specific examples of Scope 1 are fuel to power equipment, gas in company cars, and heating oil and gas.
Scope 2 refers to indirect emissions that are purchased like electricity, steam, heat, or cooling. This scope is considered indirect because the company purchases the energy but does not generate the emissions themselves.
Scope 3 refers to all additional emissions that are associated with a company’s business. This scope makes up around 90% of a total emissions footprint. When it comes down to a company using public cloud resources from suppliers like AWS, Azure, or GCP, Scope 3 is where those carbon emissions reside.
Someone described it to me in this way: when you order a beer at a restaurant, you get a layer of foam or “head” on the beer. This foam represents scopes 1 and 2. The beer itself, what’s under the foam, is representative of scope 3. Just like that freshly poured beer, Scope 3 makes up a majority of a company’s carbon emissions. GreenOps with Tanzu CloudHealth enables customers to understand some of those Scope 3 Carbon Emissions generated by using cloud based resources like AWS, Azure, or GCP.
Using GreenOps inside Tanzu CloudHealth
Looking inside Tanzu CloudHealth, we find the new GreenOps functionality in two different places today. The first is in our GreenOps Dashboard, and the second is inside our FlexReports.
The GreenOps Dashboard can be found under Multicloud in our left hand navigation menu. The GreenOps Dashboard provides users visibility into the Carbon Emissions (calculated by Metric Ton of CO2e), Power Consumption (calculated by Megawatt Hours), and Equivalencies. In the chart, we provide users with a glimpse of daily AWS EC2 usage, Azure Virtual Machine usage, and vCPU hours.
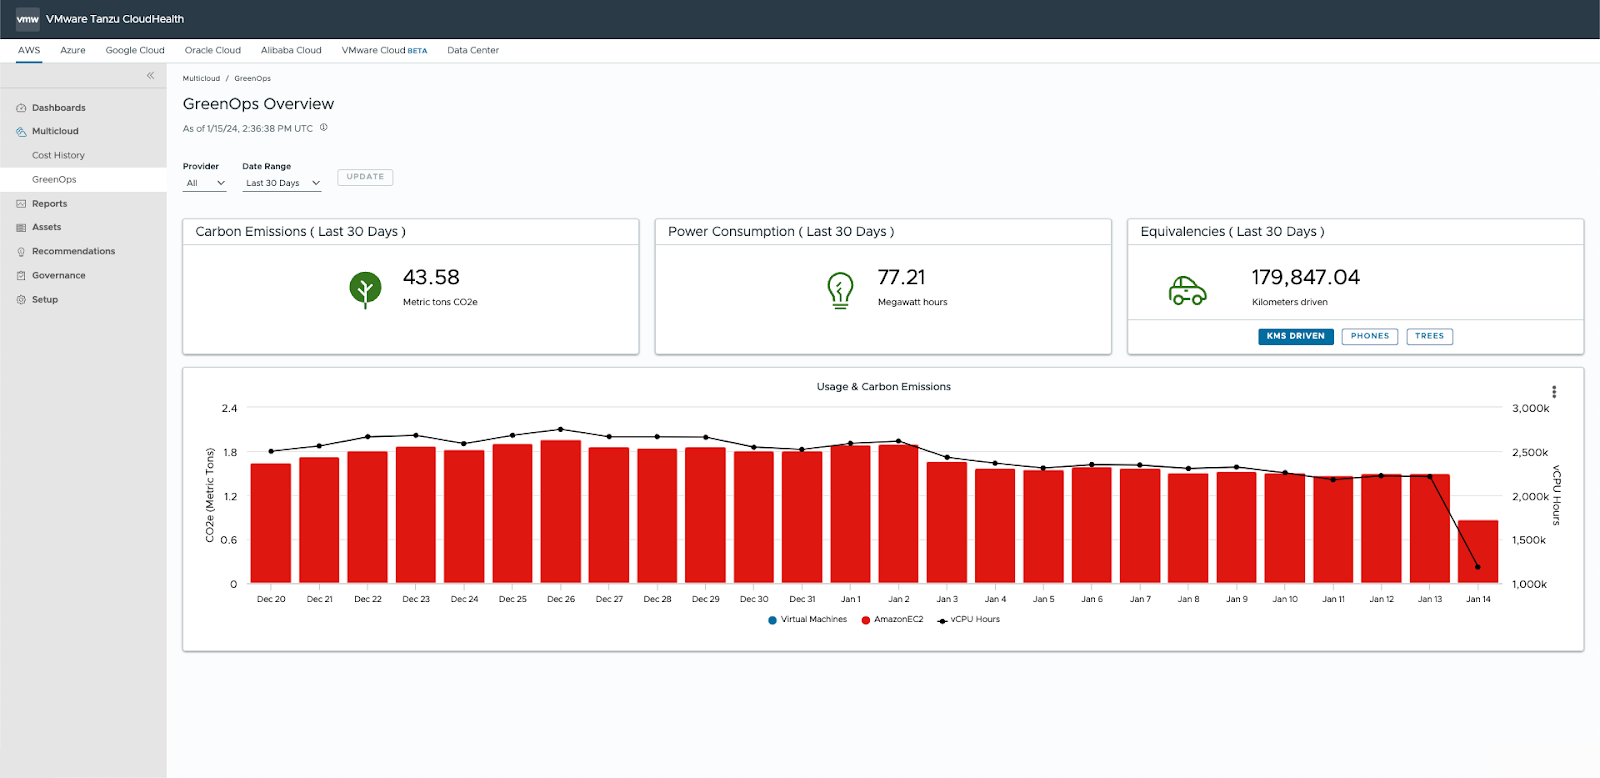
In this dashboard, users have the ability to select the cloud provider, as well as the date range they would like to evaluate (last 30 Days, last 3 months, or last 12 months). The customer also has a couple of different options to look at for Equivalencies. Options include kilometers driven, smart phones charged, and tree seedlings grown over 10 years.
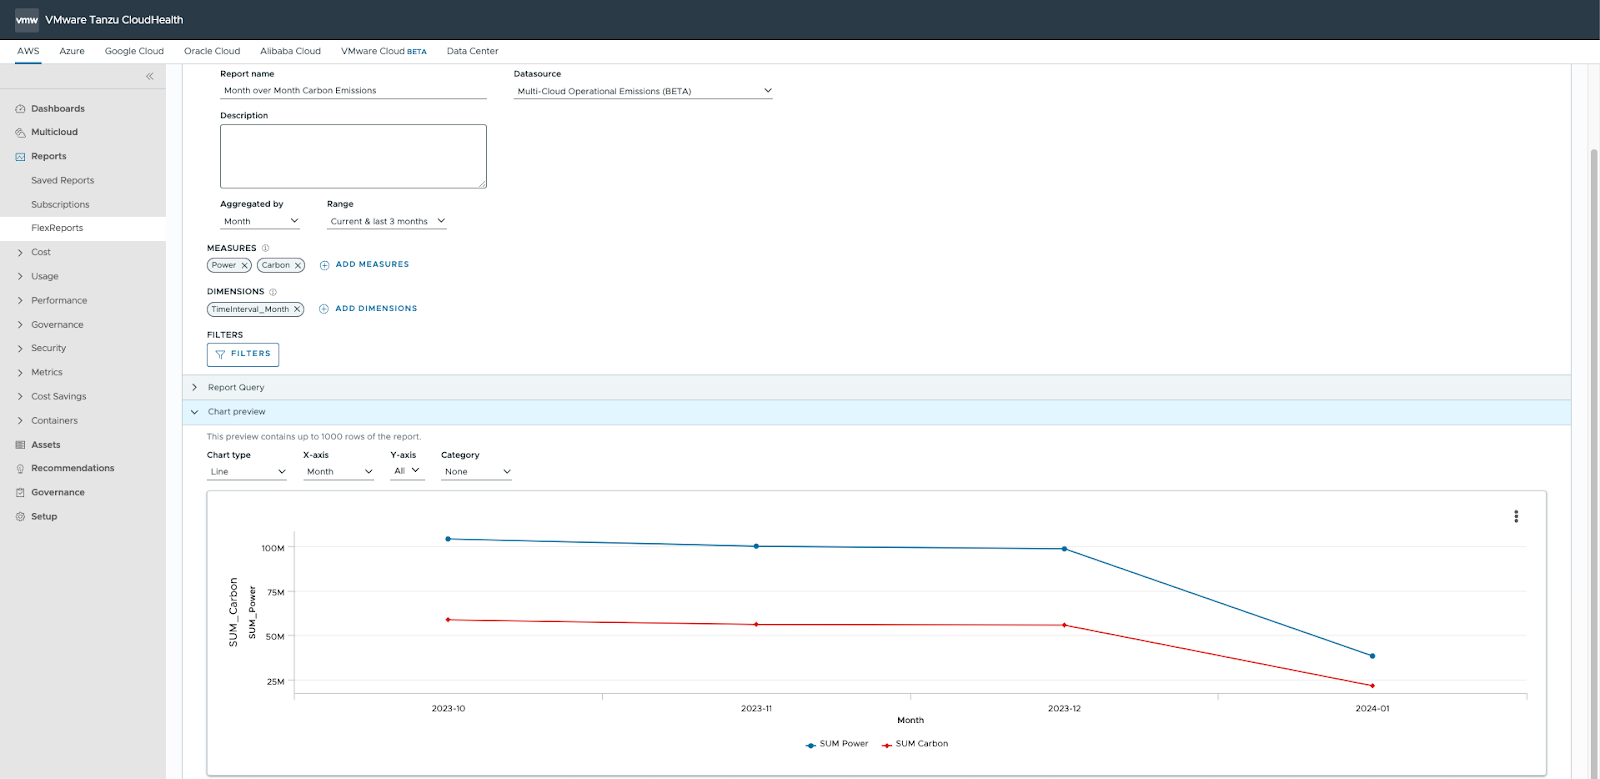
The second place that users can find GreenOps is as a dataset inside the Tanzu CloudHealth FlexReports. Leveraging a number of additional dimensions and measures, FlexReports provide a uniquely flexible and customizable way to look at cloud spend and data. The new “Multi-Cloud Operational Emissions” dataset gives users an ability to dive in depth into their carbon emissions.
In the screenshot below, we have an example using the “Multi-Cloud Operational Emissions” dataset to compare Power Usage and Carbon Emissions via a line graph for the user to have a nice visualization of the month over month emissions.
Some of the other Dimensions and Measures that can be leveraged inside FlexReports include cloud specific data like Country and Region, Resource Name and ID, Model Version, Instance Type, as well as some Tanzu CloudHealth variables like Perspectives and Organizations. All of these variables give users the ability to get granular into their Carbon Emissions and opportunities to reduce them.
Getting Started with GreenOps & Tanzu CloudHealth
Tanzu CloudHealth may not be inventing the spaceships that will deliver the human race to the New Earth. The mission of GreenOps inside of CloudHealth is to help the human race from getting to that point. GreenOps provides visibility and insights into a company’s Carbon Emissions allowing them to take steps to reduce their impact.
To begin your journey to control your company’s Carbon Emissions created by cloud infrastructure, please visit Tanzu CloudHealth and get started with a Free Trial.


