

Last month we released the Tanzu OSS Health Assessment that gives you a snapshot of how secure and compliant your open source software is, compared to what you could achieve with Tanzu Application Catalog. Underlying the Health Assessment is a sophisticated software metadata system that we’re increasingly utilizing in new ways to add value to Tanzu Application Catalog itself.
Since launching in 2020, our customers have frequently told us they love the metadata we privately deliver alongside the software in their catalogs: Software Bills of Material (SBOMS), Vulnerability Exploitability Exchange (VEX) statements, CVE scans, attestation and signatures, and more. But there’s always room to help customers better manage and interpret what can quickly become a deluge of data. In that spirit, we are excited to release new software knowledge graph features in Tanzu Application Catalog which make it easy to organize complex security metadata, with continuous SBOM scanning that helps you quickly discover and act on vulnerability remediations in your open source software.
Untangling the dependency web
The reason Bitnami and Tanzu Application Catalog are able to release software updates so fast when there’s a vulnerability patch or other update is that our automated pipelines leverage a fine-grained dependency graph across all the software we package. Every time there is a change in any software in your catalog, an update process starts. It repackages all the affected apps, runs them through sophisticated testing in multiple environments, and pushes the resulting updates to customer registries.
Where the graph is especially useful is in base operating system libraries that are packaged in many different applications. Tanzu Application Catalog supports multiple Linux distros; we know every obscure library that is packaged in every app on every distro. Thus, one CVE patch can potentially trigger thousands of software builds and releases. Every software update comes with details on what’s in the package, which vulnerabilities were patched, etc. But that data hasn’t been as easy as we’d like to act on, so we have now visualized it for you! What was once an overwhelming amount of data is now easier to navigate. And this is just the beginning.
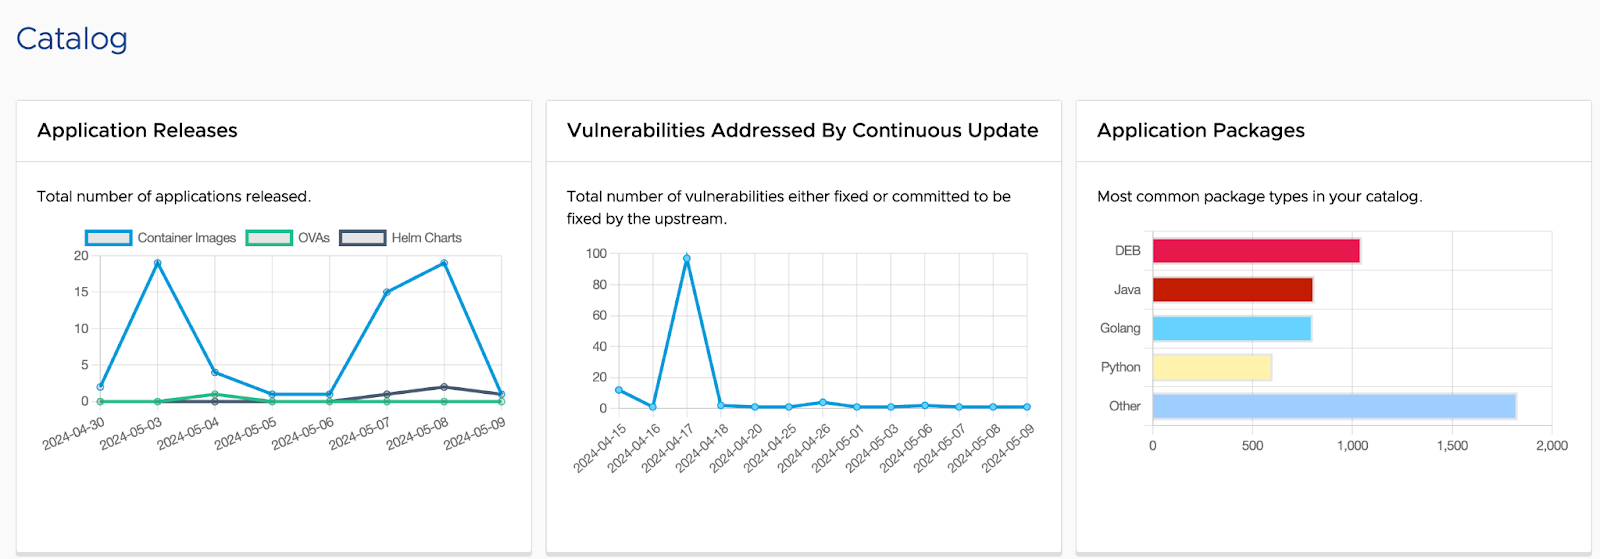
As of today, if you log into Tanzu Application Catalog you will notice some new data. Let’s look at it in detail:
-
Application releases: This is the number of new application versions that have been built, verified, and delivered into your registry or registries per day.
-
Vulnerabilities addressed by continuous update: The number of vulnerabilities that we have patched every day by releasing those updates into your registries. That number also includes future patches that upstream providers have officially committed to delivering.
-
Application packages: Shows the top package manager contributions to your OSS ecosystem to give you a sense of your reliance on and exposure to various open source ecosystems.
Knowing more about your applications
Once you’re logged into Tanzu Application Catalog, you can click on individual artifacts to see information specific to each application. Prior to today, the only implementation of our software knowledge graph in the TAC UI was the SPDX graph viewer - all your metadata was supplied in raw form like SPDX SBOMs, CSAF VEX statements, etc. We still deliver those things (and we also package them into OCI artifacts that we deliver to your private registry), you can now see the data in new graphs and tabular format.
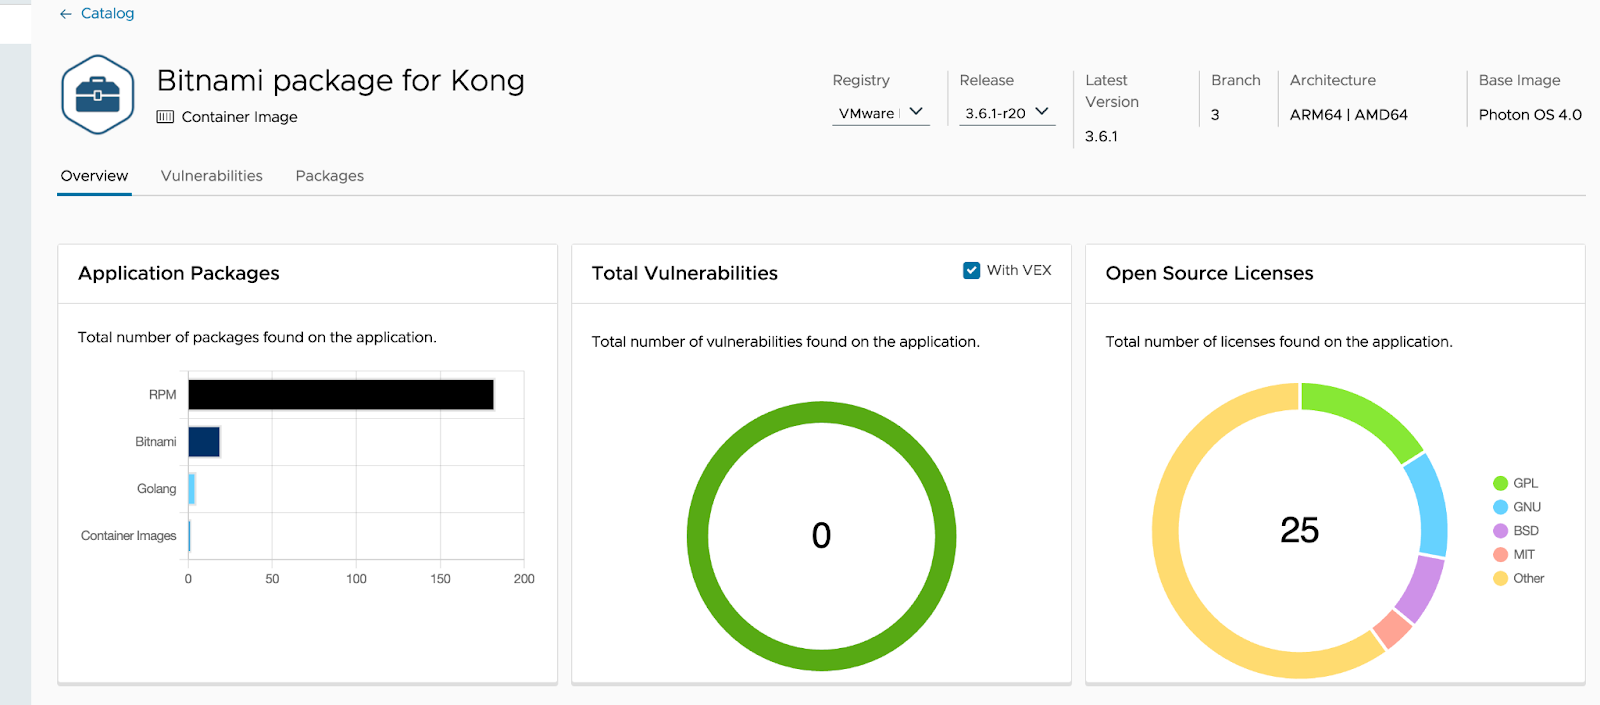
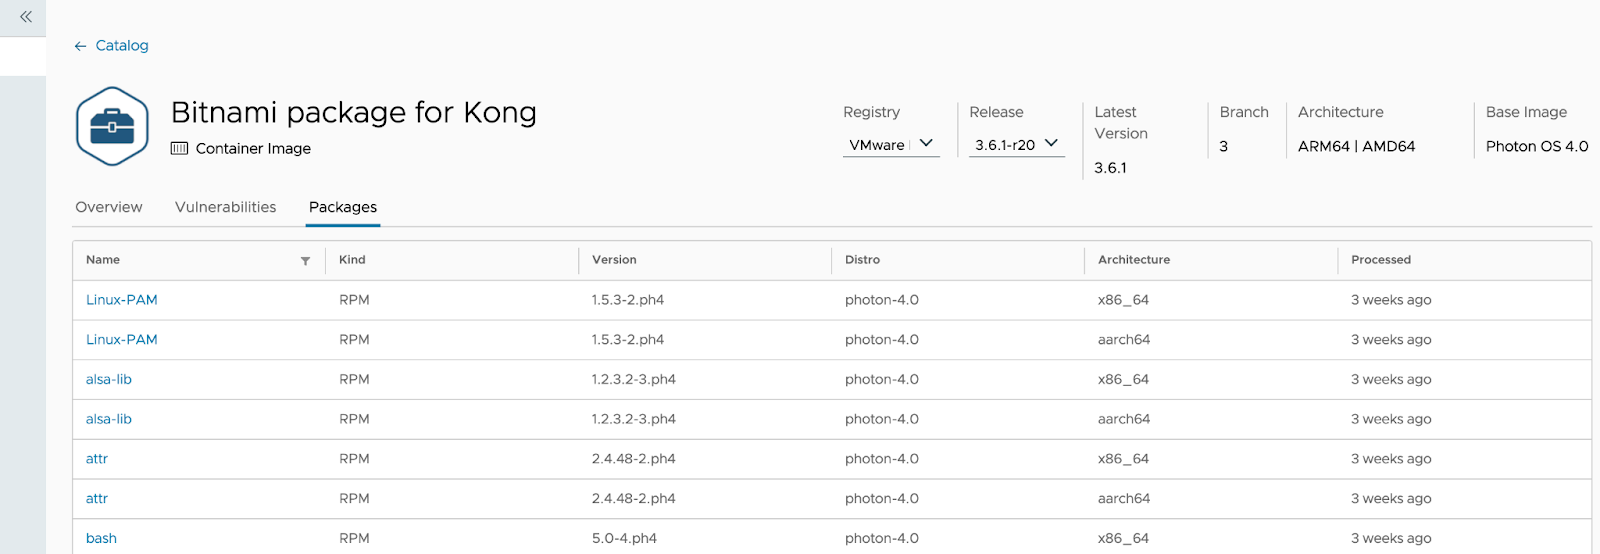
At first glance, you can see the packages included in the artifact, the number of vulnerabilities grouped by severity, and a chart showing the open source licenses included. You’ll also see tabs that take you to tables showing specific vulnerabilities in the artifacts and which specific packages are bundled.
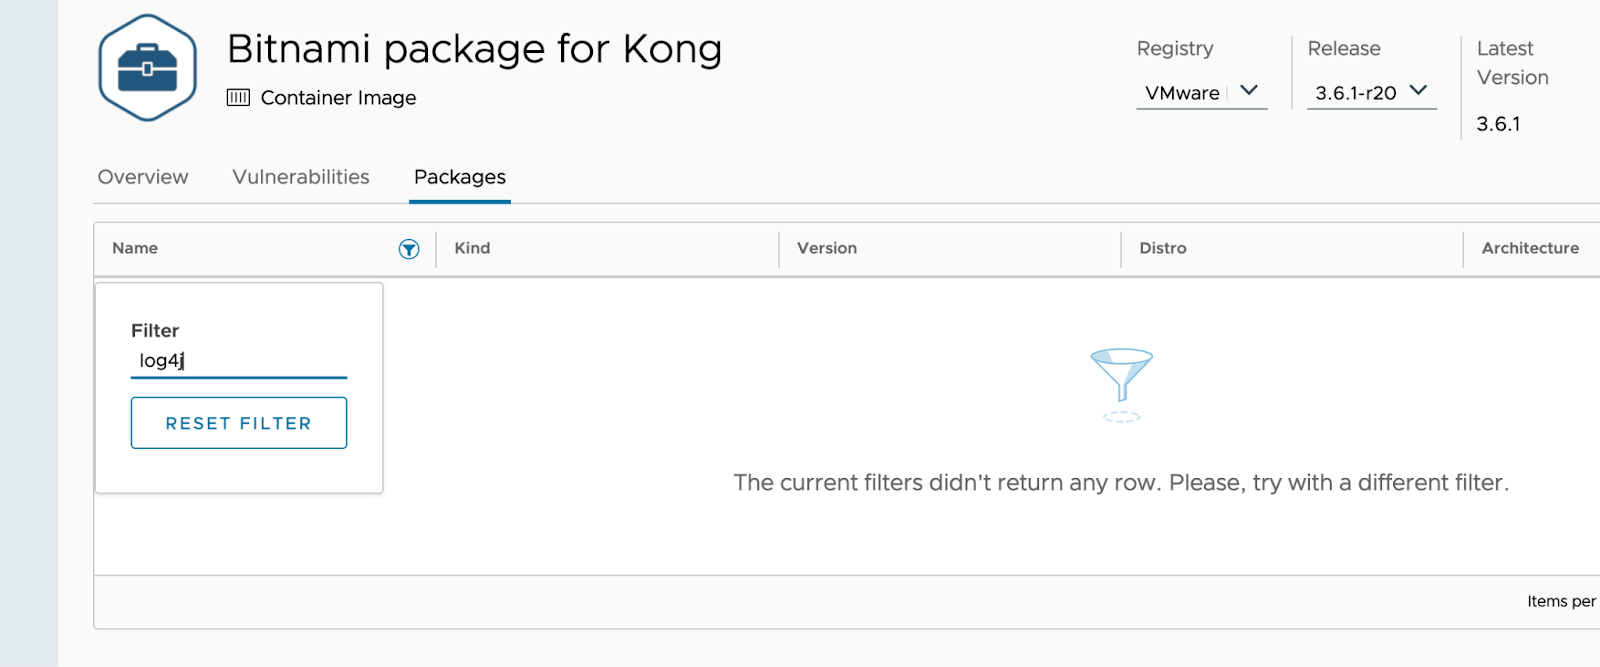
Filters can be used on several fields so you can drill down on specific packages you’re looking for.
Keeping your catalog safe with continuous scanning
In the past, when we delivered your software with CVE scans at build time, you had a static snapshot of vulnerabilities in the image when it was constructed. With the software knowledge graph, you’re seeing the result of that SBOM being scanned for CVEs every few hours. This means that you can log into the TAC UI and check right away if you’re affected by a new vulnerability you’ve become aware of, and see if there’s a patched release available.
Putting VEX into practice with vulnerability triaging
Vulnerability Exploitability Exchange statements are a way to communicate additional context around CVE findings in your software - it helps reduce the noise that occurs when CVE scanners flag vulnerabilities that are not actually exploitable. Tanzu Application Catalog has been a pioneer in putting VEX into practice as a way to give our customers additional information and assessments on vulnerabilities. We have a team that continuously monitors any vulnerabilities in our own PhotonOS distribution that are not remediated by the maintainers.
Those assessments are downloadable in Common Security Advisory Framework (CSAF) format, and can be used for reducing the noise in your vulnerability scanners. With this update, we are now making that information browsable from the user interface as well.
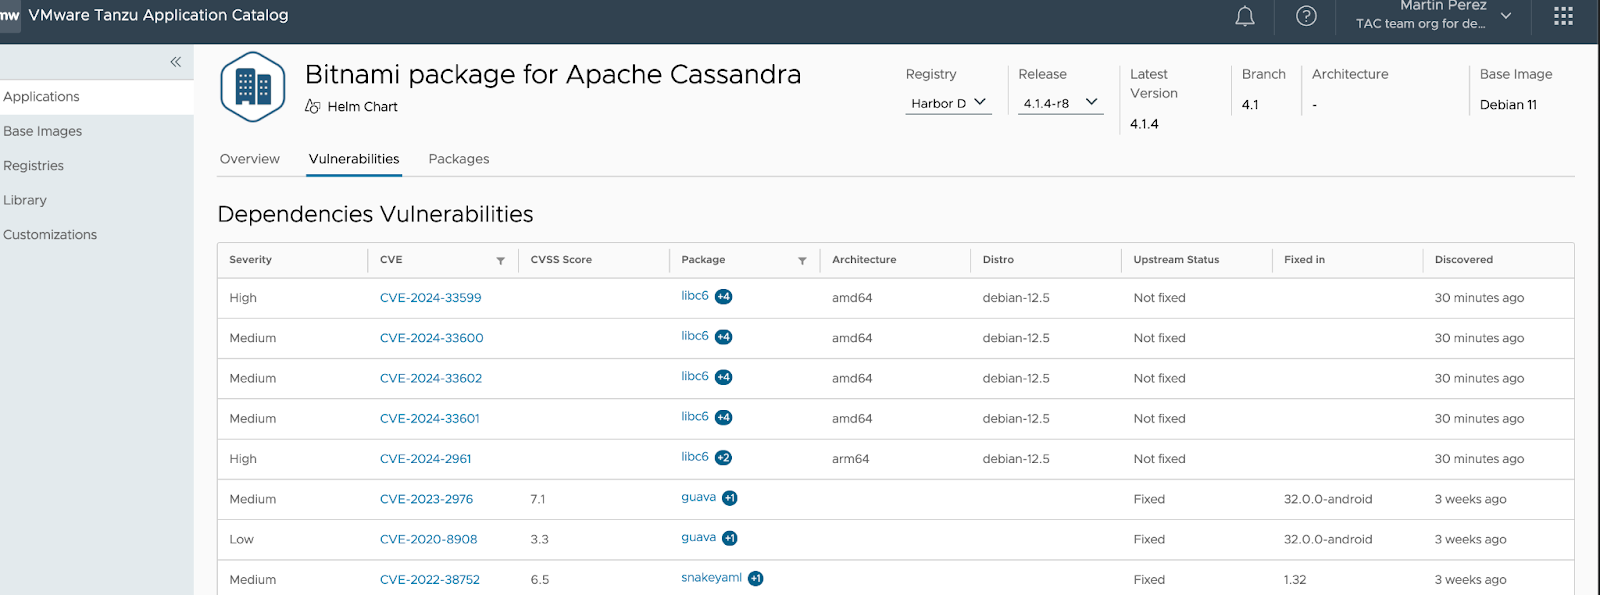
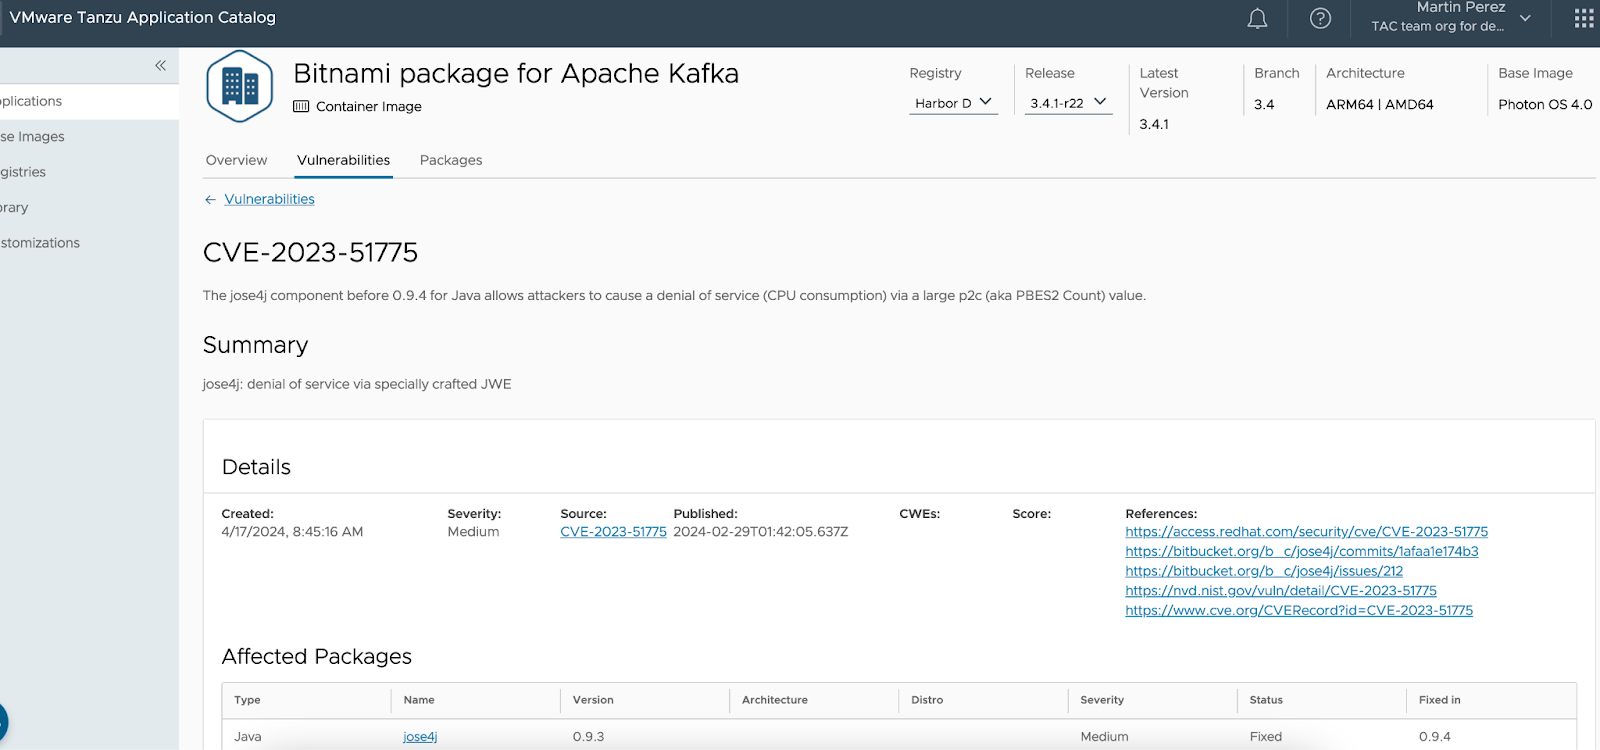
When clicking on any vulnerability link, for example in the vulnerabilities section of any of your application releases, you will see details about that particular vulnerability displayed in the user interface.
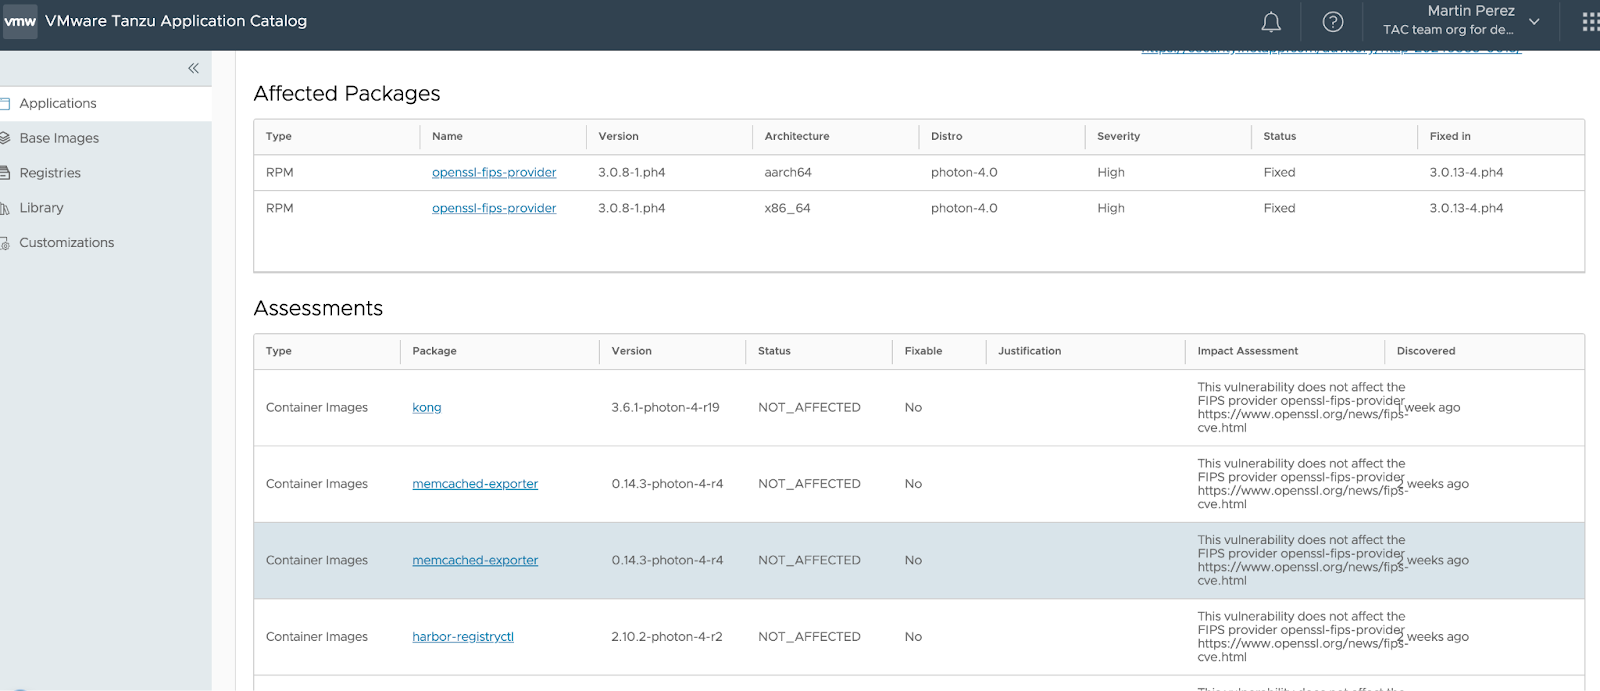
When you scroll down through the page you will find a list of any assessments that our security team has collected about a vulnerability, including the impact and whether it might affect you or not. All the information provided in these assessments follows CISA’s minimum requirements for Vulnerability Exploitability eXchange (VEX) recommendations. This means that as these CISA requirements become necessary for doing business with government entities, you’ll be covered if your open source apps are acquired through TAC.
Digging into the history of your catalog
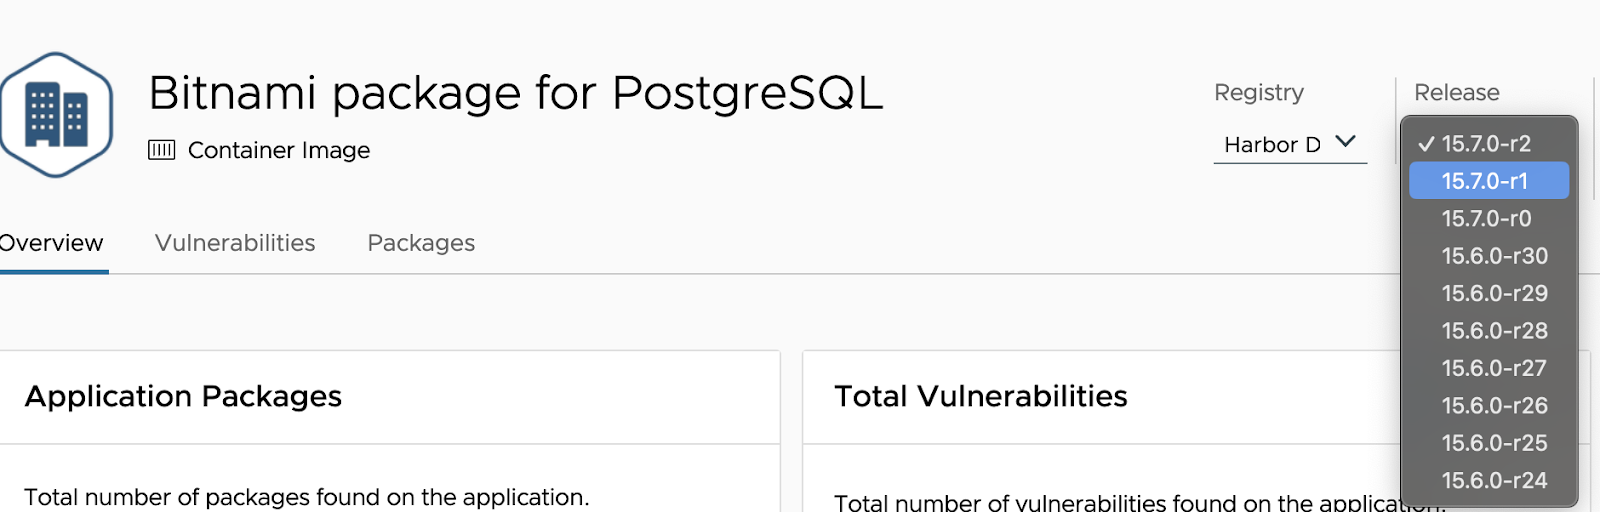
All the information that we are introducing above is now available not only for the latest release of your applications, but for the entire history of your catalog. From now on, you will be able to browse all the releases for your applications and compare one release to another. To check an older application release, simply navigate to the top of an application’s details page and you will see a drop-down menu to choose which application release you want to explore. This includes the entire software knowledge graph, so you can compare releases and see if you need to upgrade your running applications.
More software knowledge graph goodness coming soon
The Tanzu Application Catalog software knowledge graph is a powerful capability that will continue to deliver new product features over the next year, including integrations with Tanzu Platform. If you would like to understand the basics about TAC, check out the wealth of information on the TAC webpage and documentation.
We would love to know your thoughts and your feedback. So, please reach out to us, we will be more than happy to learn more about your ideas in this area. For more information about Tanzu Application Catalog’s vulnerability management capabilities in this whitepaper - Enabling Efficient Vulnerability Management with VEX, SBoM & CVE Scan Results and read about about how we help customers keep up with the latest SLSA compliance levels and the like here.


