Gathering Metrics from Spring Boot on Kubernetes with Prometheus and Grafana
Spring Boot developers are used to making metrics available from their application using Spring Boot Actuator and Micrometer, but Prometheus expects metrics to be in a specific format. In this guide, you’ll learn how to expose both standard and custom metrics in your Spring Boot application, gather them using Prometheus, and visualize them in Grafana.
All of the code for this guide can be found on GitHub.
Export Metrics for Prometheus from Spring Boot
Thanks to Spring Boot Actuator there are only a couple of steps you need to take to start exporting basic metrics from your application that Prometheus can gather. By default, Spring Boot Actuator provides a lot of metrics out of the box, including insight into the JVM, the machine the application is running on, and the web server that’s backing the application. To enable these insights, you can include the Spring Boot Actuator dependency in your pom.xml file, as well as the dependency that will provide them for Prometheus:
<dependency>
    <groupId>org.springframework.boot</groupId>
    <artifactId>spring-boot-starter-actuator</artifactId>
</dependency>
<dependency>
    <groupId>io.micrometer</groupId>
    <artifactId>micrometer-registry-prometheus</artifactId>
</dependency>
Internally, including these dependencies makes an additional metrics endpoint available at /actuator/prometheus, but by default this endpoint isn’t reachable by outside services. You can expose the new endpoint by explicitly enabling it in your application.yml file, alongside the default health and metrics endpoints. You’ll also want to provide an application tag to your metrics so Grafana knows how to organize the metrics. Below, the application tag is set to match the name of the application, defined in the spring.application.name property:
spring:
  application:
    name: spring-prometheus-demo
management:
  endpoints:
    web:
      exposure:
        include: health, metrics, prometheus
  metrics:
    tags:
      application: ${spring.application.name}
That’s it! Upon running your application, you’ll see a new endpoint available that you can point Prometheus to. As with any Spring Boot application, you can start it with the following command:
./mvnw spring-boot:run
Once started, you’ll find a huge list of metrics made available at http://localhost:8080/actuator/prometheus!
Adding a Custom Spring Boot Metric with Prometheus
Insight into the machine running your application and the JVM it’s on is a great start. But what if you want to track custom metrics? If your application is running a website, maybe you want to track how many page hits certain endpoints are receiving, or how many times a resource with a specific ID is requested.
Since these metrics are being taken care of by Spring Boot Actuator, any custom metrics you generate are picked up by Prometheus as well! Consider a scenario in which you want to track how many times the main page of the website receives a request. For this, you’d use a simple counter, increasing it every time the page is requested. Take a look at the following RestController, which sets up a counter called visitCounter and adds it to the default MeterRegistry. Additionally, the visitCounter is incremented every time the / endpoint is requested, fulfilled by the index() method:
@RestController
public class WebController {

    Counter visitCounter;

    public WebController(MeterRegistry registry) {
        visitCounter = Counter.builder("visit_counter")
            .description("Number of visits to the site")
            .register(registry);
    }

    @GetMapping("/")
    public String index() {
        visitCounter.increment();
        return "Hello World!";
    }
}
Restart the application and visit it running at http://localhost:8080/ a few times to increase the counter. You can then see the value of this counter by visiting http://localhost:8080/actuator/prometheus:
visit_counter_total 5.0
This same method can be used for timers and gauges as well.
Deploying the Application in Kubernetes
This guide assumes you’ve already deployed Prometheus to the Kubernetes cluster that you’re deploying your application to. You’ll also need to first build a container for your application, which you can do using the Maven spring-boot:build-image command as described in this guide on the Spring website. Once built and pushed to the container repository of your choice, you’re ready to deploy to Kubernetes!
You’ll need to deploy three things: a Deployment to run the application, a Service to access the application, and a ServiceMonitor to tell Prometheus how to gather metrics from your application. You can find the full deployment YAML here. First, take a look at the Deployment and the Service:
---
apiVersion: apps/v1
kind: Deployment
metadata:
  name: spring-prometheus-demo
  labels:
    app: spring-prometheus-demo
spec:
  replicas: 1
  selector:
    matchLabels:
      app: spring-prometheus-demo
  template:
    metadata:
      labels:
        app: spring-prometheus-demo
    spec:
      containers:
        - name: spring-prometheus-demo
          image: brianmmcclain/spring-prometheus-demo:0.0.1-SNAPSHOT
          imagePullPolicy: Always
          ports:
            - containerPort: 8080

---
apiVersion: v1
kind: Service
metadata:
  name: spring-prometheus-demo-service
  labels:
    app: spring-prometheus-demo
spec:
  selector:
    app: spring-prometheus-demo
  ports:
    - protocol: TCP
      name: http-traffic
      port: 8080
      targetPort: 8080
The above creates a Deployment from the container image of the application, in this case pointing to my personal build at brianmmcclain/spring-prometheus-demo:0.0.1-SNAPSHOT. It also gives it the label of app: spring-prometheus-demo. The Service then uses that label as a selector to know how to attach to the application. The Service also receives a label of app: spring-prometheus-demo, which the ServiceMonitor will use to find the Service. One thing to note is that the port receives a name of http-traffic, which you can see the ServiceMonitor reference below:
---
apiVersion: monitoring.coreos.com/v1
kind: ServiceMonitor
metadata:
  name: spring-prometheus-demo-service-monitor
spec:
  selector:
    matchLabels:
      app: spring-prometheus-demo
  endpoints:
    - port: http-traffic
      path: "/actuator/prometheus"
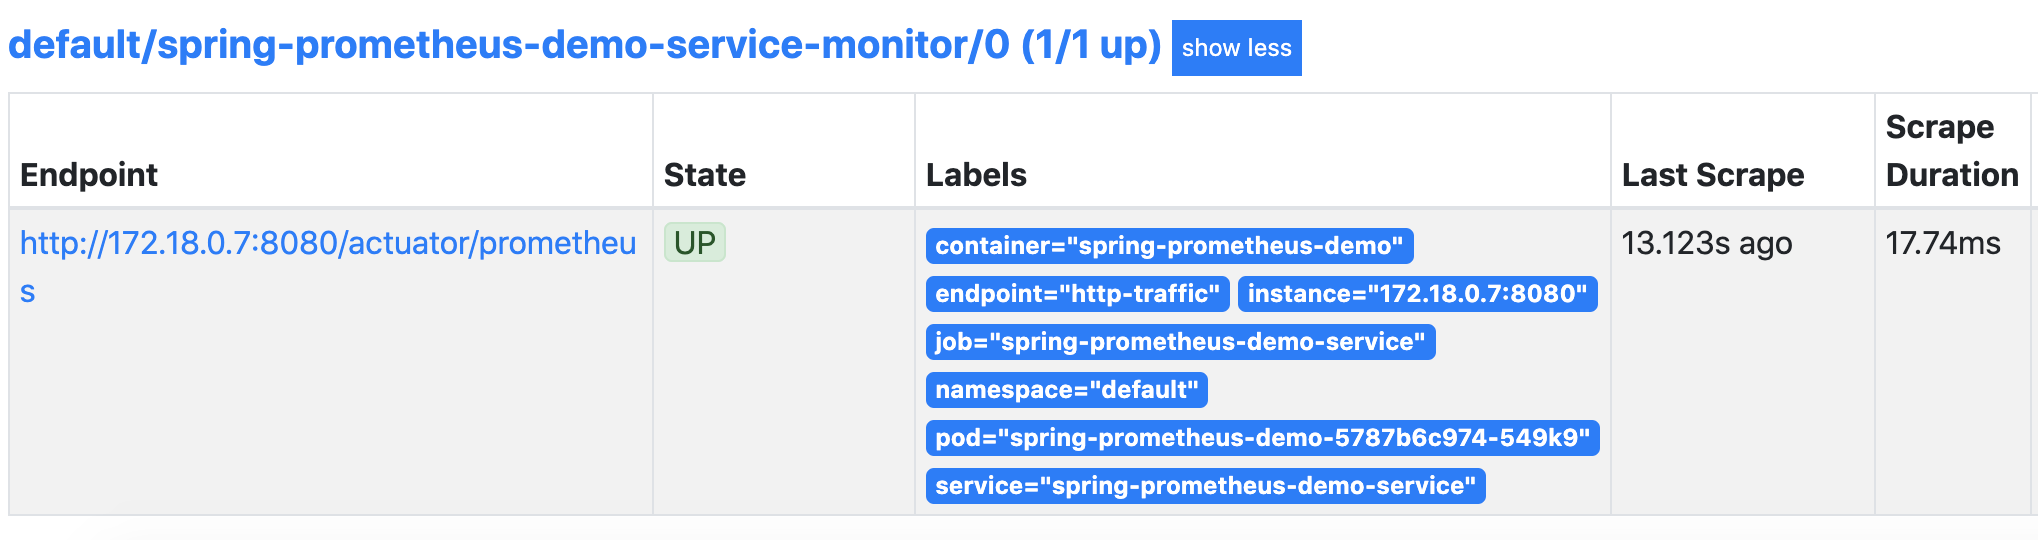
Here a ServiceMonitor is created, which looks for a Service with the label app: spring-prometheus-demo. It then defines an endpoint to use to scrape metrics, referring to the port named http-traffic and the path /actuator/prometheus, which as you saw is where Spring Boot exposes the Prometheus-formatted metrics.
You can verify that Prometheus is scraping the new endpoint by checking the targets it has registered, found under “Status” drop-down menu:
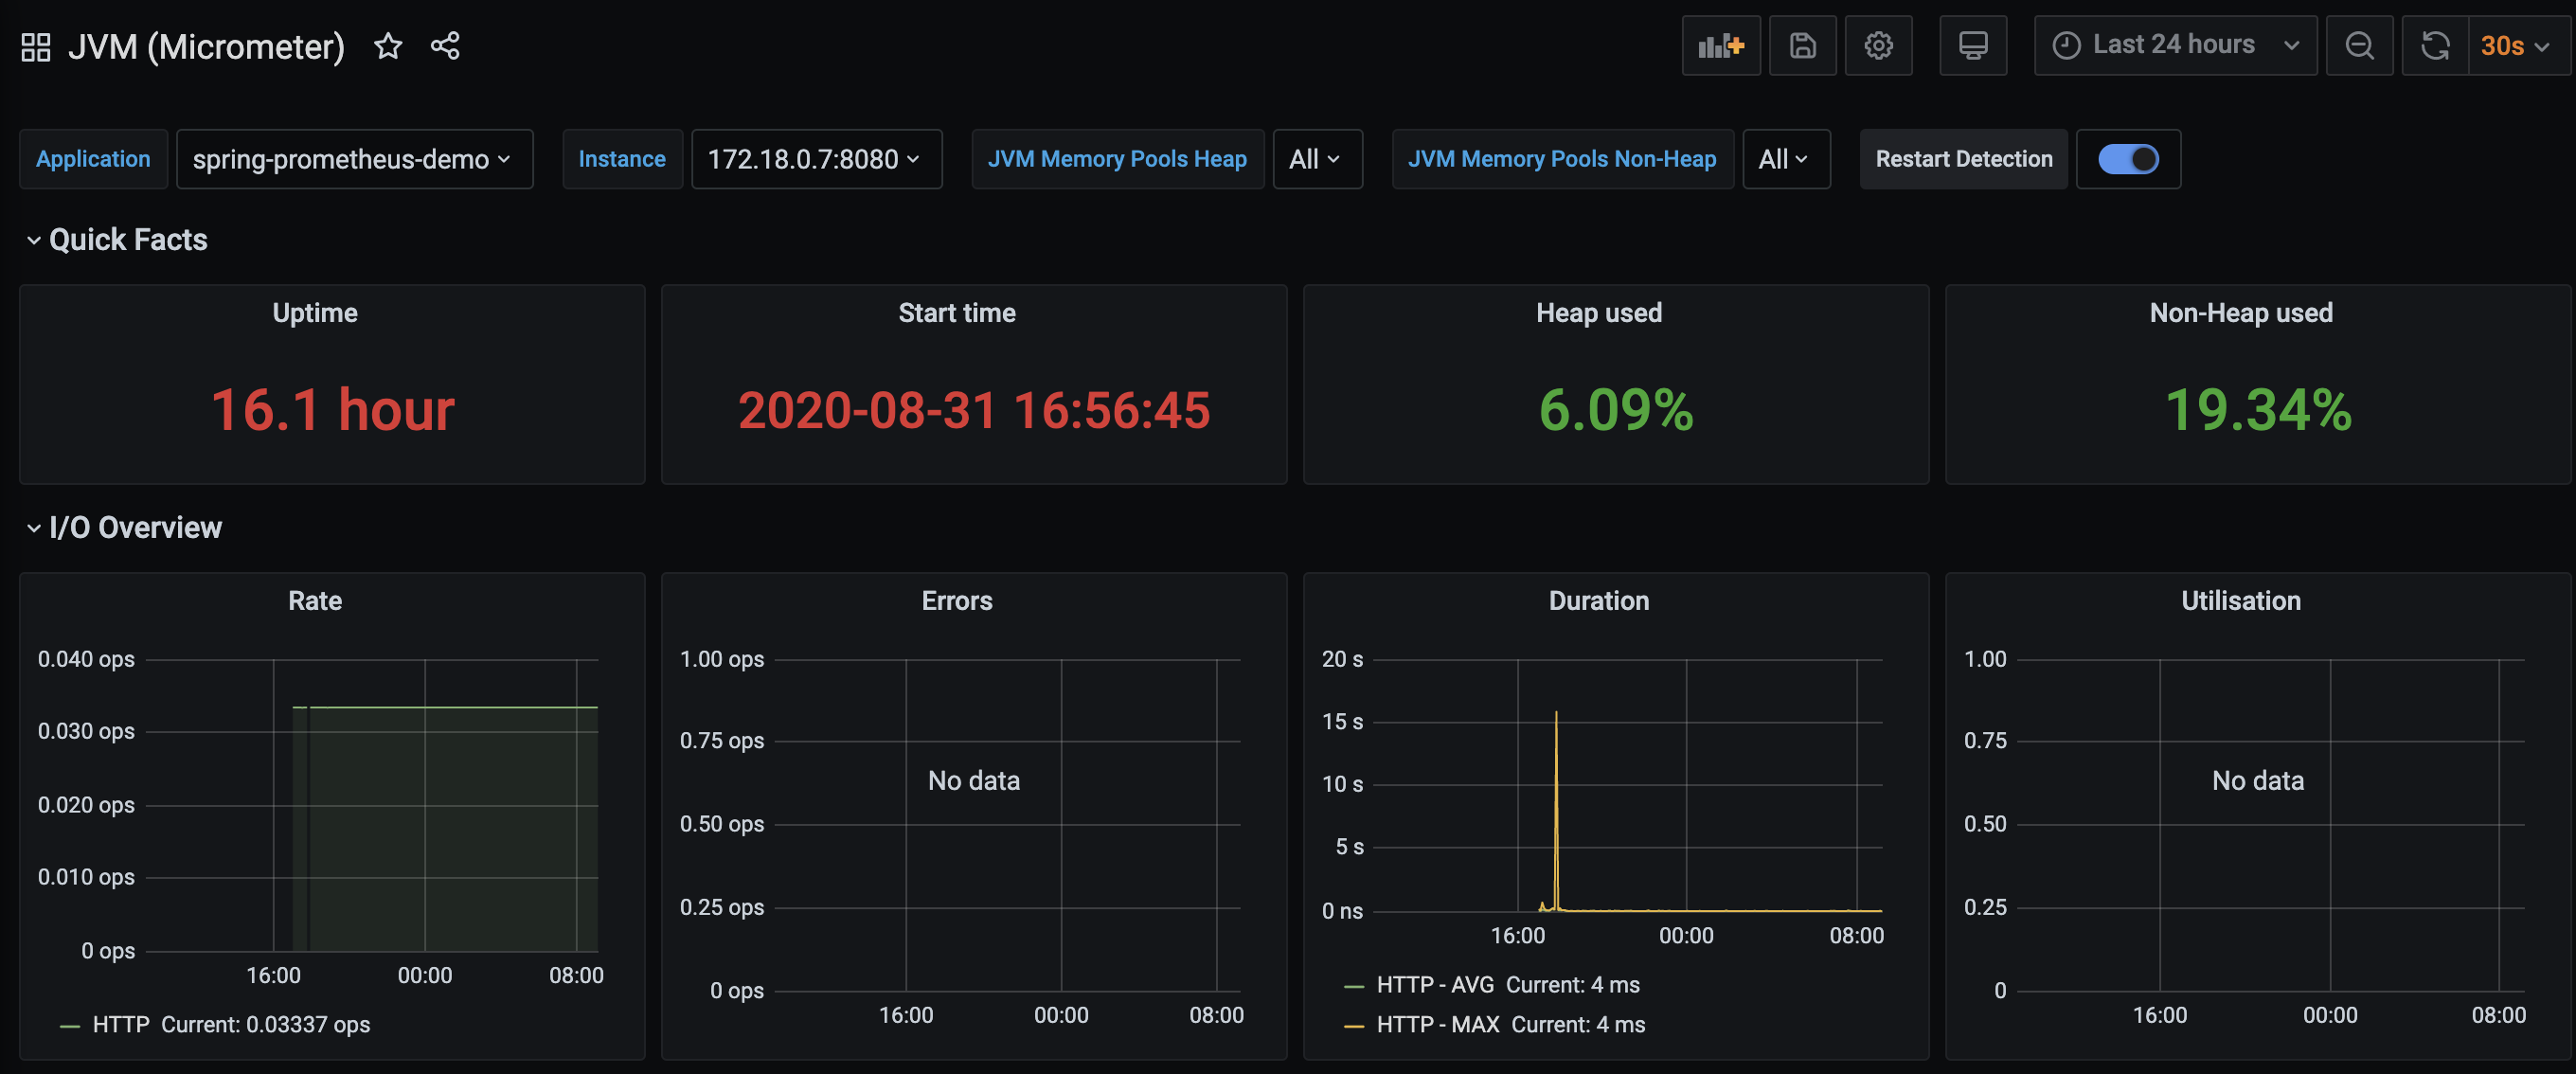
Visualizing the JVM Metrics
The Grafana website maintains a great repository of community-made dashboards, including one for visualizing JVM metrics from Micrometer. Even better, Grafana makes it very easy to import existing dashboards. While it may take a few minutes for Prometheus to pick up some of the metrics, upon importing the dashboard, you’ll see a whole plethora of metrics start to be populated.
But what about the custom metric added to the code? For this, you can create a new panel by clicking the graph with the plus sign symbol on the top of the dashboard. You’ll be presented with a screen with a number of options. What you’re interested in is the query, however just entering the name of the visits metric (visit_counter_total) will show the cumulative total number of visits over time rather than a pattern of spikes and dips. This is where we need the help of the rate function, which “calculates the per-second average rate of increase of the time series in the range vector.” Put in simpler terms, it turns the accumulative counter into a time-series measurement. One-second intervals can also inject a lot of noise into the graph, so you can further modify the query to look at it in 5-minute intervals as well. In all, this turns the query into:
rate(visit_counter_total[5m])
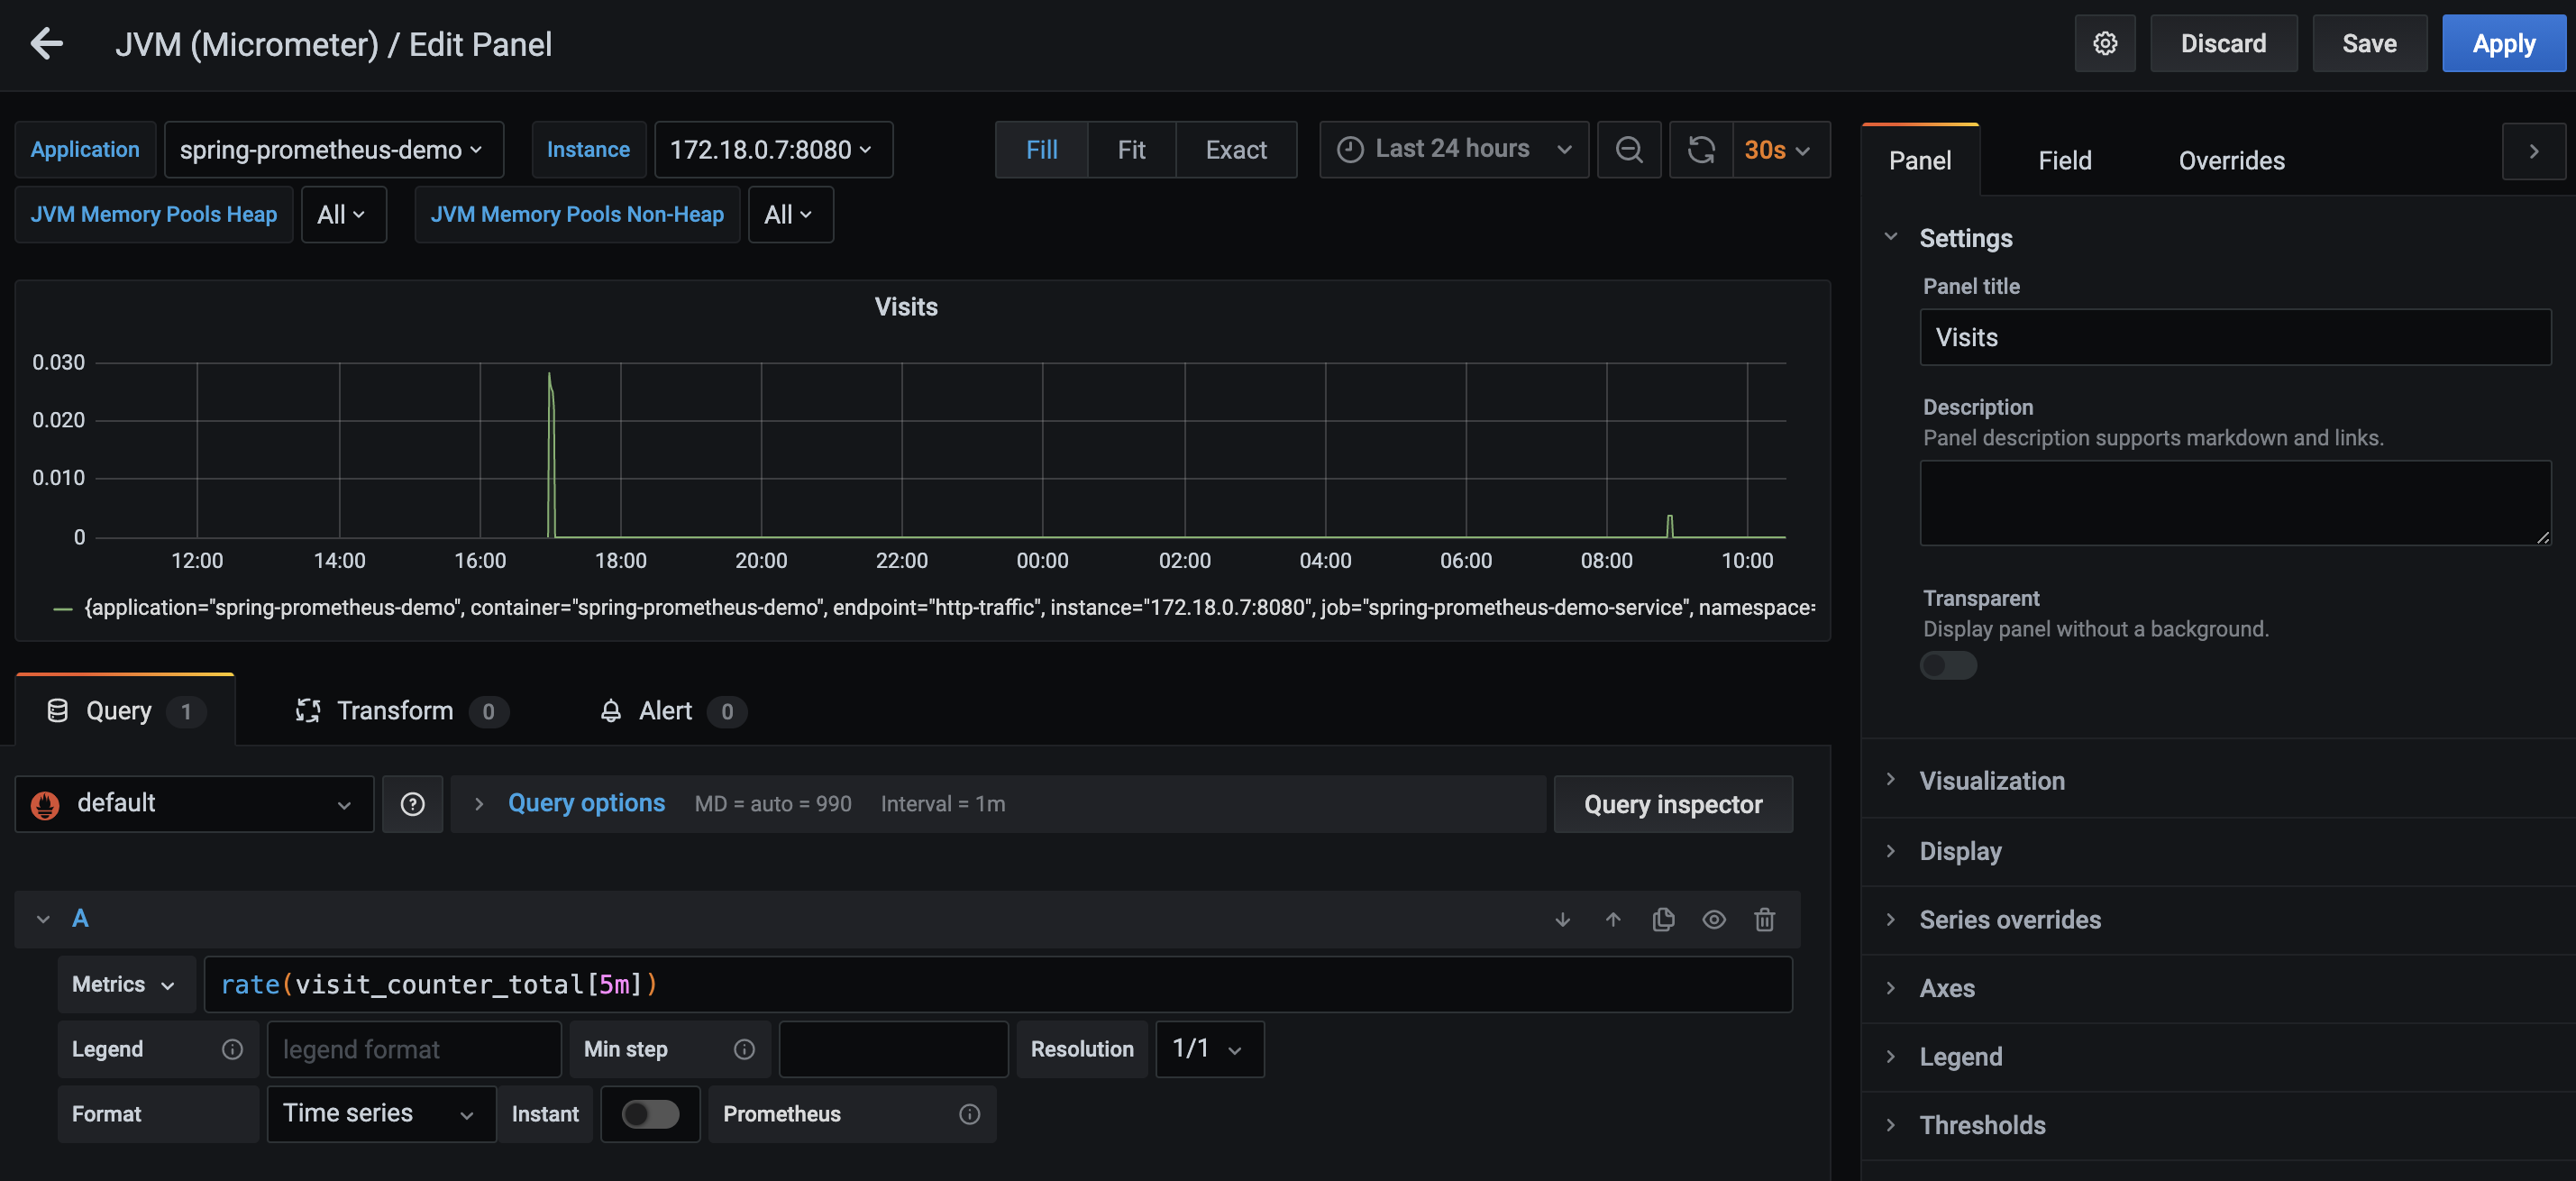
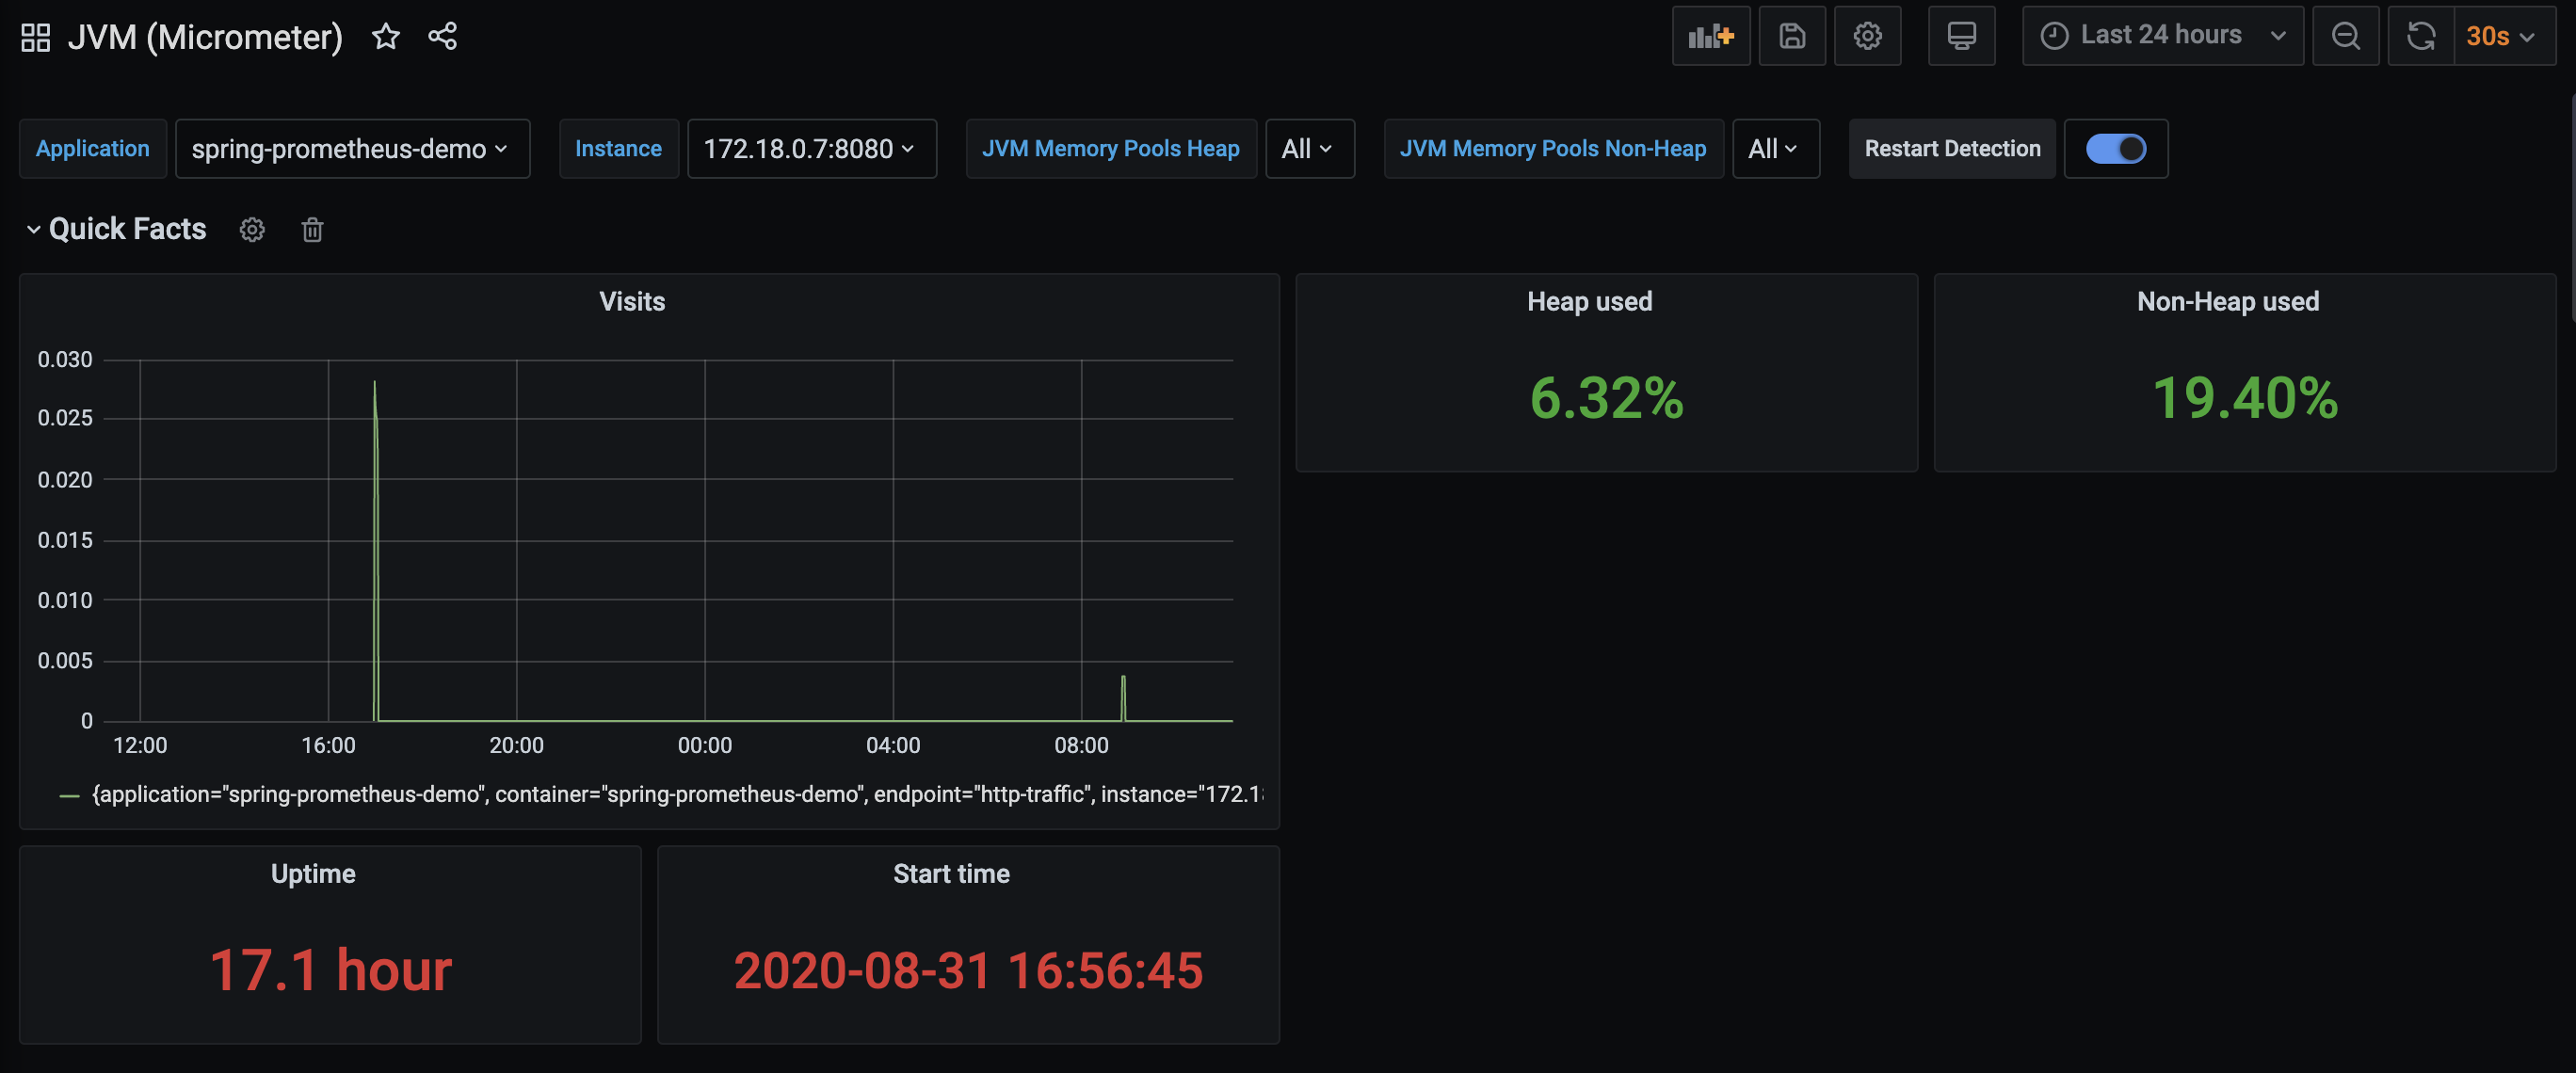
Apply your changes, and you’ll see the new graph added to the dashboard!
What’s Next?
Hopefully this gave you an idea of how to start gathering metrics, both standard and custom, from your Spring Boot applications using Prometheus. Micrometer provides a huge array of tools you can take advantage of, all of which are automatically gathered by Prometheus. Grafana also provides a rich set of features for building your own queries, which may look intimidating at first, but is made easier thanks to great documentation and examples.
Give Feedback
Help us improve by sharing your thoughts.