Reactive Observability in Spring Boot 3 with Micrometer
Version Note
This guide was written for Spring Framework 6 and Spring Boot 3.0.0. Your results might vary with other versions.
Since Spring Framework 6/SpringBoot 3, metrics and tracing get handled by Micrometer - a vendor-neutral API for instrumenting code. Micrometer also makes available and sends metrics to aggregators such as Prometheus, InfluxDB, Netflix Atlas and more.
In this guide, we will take a look at the updated support for Micrometer Tracing, which replaces Spring Cloud Sleuth support. There is a great write-up on this, which takes care of explaining a good chunk of details in a WebMVC setting.
In case you are looking to migrate from Sleuth to Micrometer, please see this helpful Wiki page. It describes and gives samples related to the scenarios you will encounter when deciding/making the change from Sleuth to the new Micrometer API.
Start with an Observation example
Let's start with a quick example demonstrating Micrometer's Observation API in a thread-friendly setting. For instance, we can use it to observe a Runnable submitted to an Executor.
Create the sample application with the following settings on the Spring Initializr:
Artifact ID:
simple-observation
Dependencies:
- Lombok
- Actuator
Spring Boot:
- 3.0.0
Packaging:
- Jar
Java Version:
- 17
Type:
- Maven
The full sample listing follows in ObservationApplication.java:
@Slf4j
@SpringBootApplication
public class ObservationApplication {

  public static void main(String[] args) {
    SpringApplication.run(ObservationApplication.class, args);
  }

  @Bean
  ApplicationListener<ApplicationStartedEvent> doOnStart(
    ObservationRegistry registry
  ) {
    return event -> generateString(registry);
  }

  public void generateString(ObservationRegistry registry) {
    String something = Observation.createNotStarted("server.job", registry) //1
      .lowCardinalityKeyValue("jobType", "string") //2
      //3
      .observe(() -> {
        log.info("Generating a String...");
        try {
          Thread.sleep(1000);
        } catch (InterruptedException e) {
          e.printStackTrace();
          return "NOTHING";
        }
        return "SOMETHING";
      });

    log.info("Result was: " + something);
  }
}
A few things are happening in this code:
- Create an instance of
Observationand bind it to anObservationRegistryas stated in the Micrometer documentation. - To better observe our invocation, add low cardinality keys. These are keys whose value will have a bounded number of possible values. For high cardinality keys - having unbounded possible values - use the
.highCardinalityKeyValue()method. - Rather than manually calling
.start()and.stop(), use theobserve(Runnable)method to isolate the monitored code in its ownRunnableclosure. You can also use theobserveChecked(CheckedRunnable)for methods that throw Exceptions.
How Micrometer tracing and observation works
An ObservationHandler wraps the Observation lifecycle and execute its methods on lifecycle events. An ObservationHandler reacts only to supported implementations of an Observation.Context - this context passes state between handler methods - and can create all kinds of instrumentation like metrics, spans, or logs by reacting to the lifecycle events of an observation, such as:
start- This happens when theObservation#start()method gets called.stop- This happens when theObservation#stop()method gets called.error- This event happens when theObservation#error(exception)method gets called.event- This happens when theObservation#event(event)method gets called.scope started- Observation opens a scope. The scope must be closed when no longer used. Handlers can create thread-local variables on start that get cleared when the scope is complete. This event happens when theObservation#openScope()method gets called.scope stopped- Observation stops a scope. This event happens when theObservation.Scope#close()method gets called.
An observation state diagram (per documentation) looks like:
         Observation          Observation
         Context              Context
 Created ───────────► Started ───────────► Stopped
The state diagram for observation scopes:
               Observation
               Context
 Scope Started ─────────────────► Scope Finished
NOTE: Access to the Observation Docs is essential to gain more details as your needs evolve.
The Spring Boot autoconfiguration creates an ObservationRegistry responsible for the configuration and propagation of Observations. Additionally, we get multiple ObservationHandlers that handle various instrumentation objectives (e.g., tracing, metrics, logging, etc..). As an example, the DefaultMeterObservationHandler provides micrometer Timer and Counter metrics to observations.
Additionally, non-auto-configured handlers exist, such as the ObservationTextPublisher. This handler logs the context during each handled event.
Log observation events by declaring a bean of type ObservationTextPublisher in the main application configuration:
public class ObservationApplication {
 ...
 @Bean
 ObservationTextPublisher otp() {
 	return new ObservationTextPublisher();
 }
}
Execute the application:
mvn spring-boot:run
You will see logs that the ObservationTextPublisher emitted when we execute our ObservationApplication. I've removed timestamps and only included one descriptive log line for brevity:
INFO 90538 --- [ main] i.m.o.ObservationTextPublisher : START - name='server.job', contextualName='null', error='null', lowCardinalityKeyValues=[jobType='string'], highCardinalityKeyValues=[], map=[]
INFO 90538 --- [ main] i.m.o.ObservationTextPublisher : OPEN -
name='server.job', contextualName='null', error='null', lowCardinalityKeyValues=
[jobType='string'], highCardinalityKeyValues=[], map=[class io.micrometer.core.instrument.
Timer$Sample='io.micrometer.core.instrument.Timer$Sample@205bed61', class io.micrometer.core.
instrument.LongTaskTimer$Sample='SampleImpl{duration(seconds)=5.60409E-4, duration(nanos)
=560409.0, startTimeNanos=}']
INFO 90538 --- [ main] c.e.o.ObservationApplication : Generating a String...
INFO 90538 --- [ main] i.m.o.ObservationTextPublisher : CLOSE - name='server.job',...]
INFO 90538 --- [ main] i.m.o.ObservationTextPublisher : STOP - name='server.job',...]
INFO 90538 --- [ main] c.e.o.ObservationApplication : Result was: SOMETHING
The ObservationTextPublisher shows each stage an Observation went through, along with some metadata.
Now that we have reviewed the basics, let's move on and put together an example using the reactive Spring WebFlux and Micrometer.
The reactive Spring Boot 3 sample setup
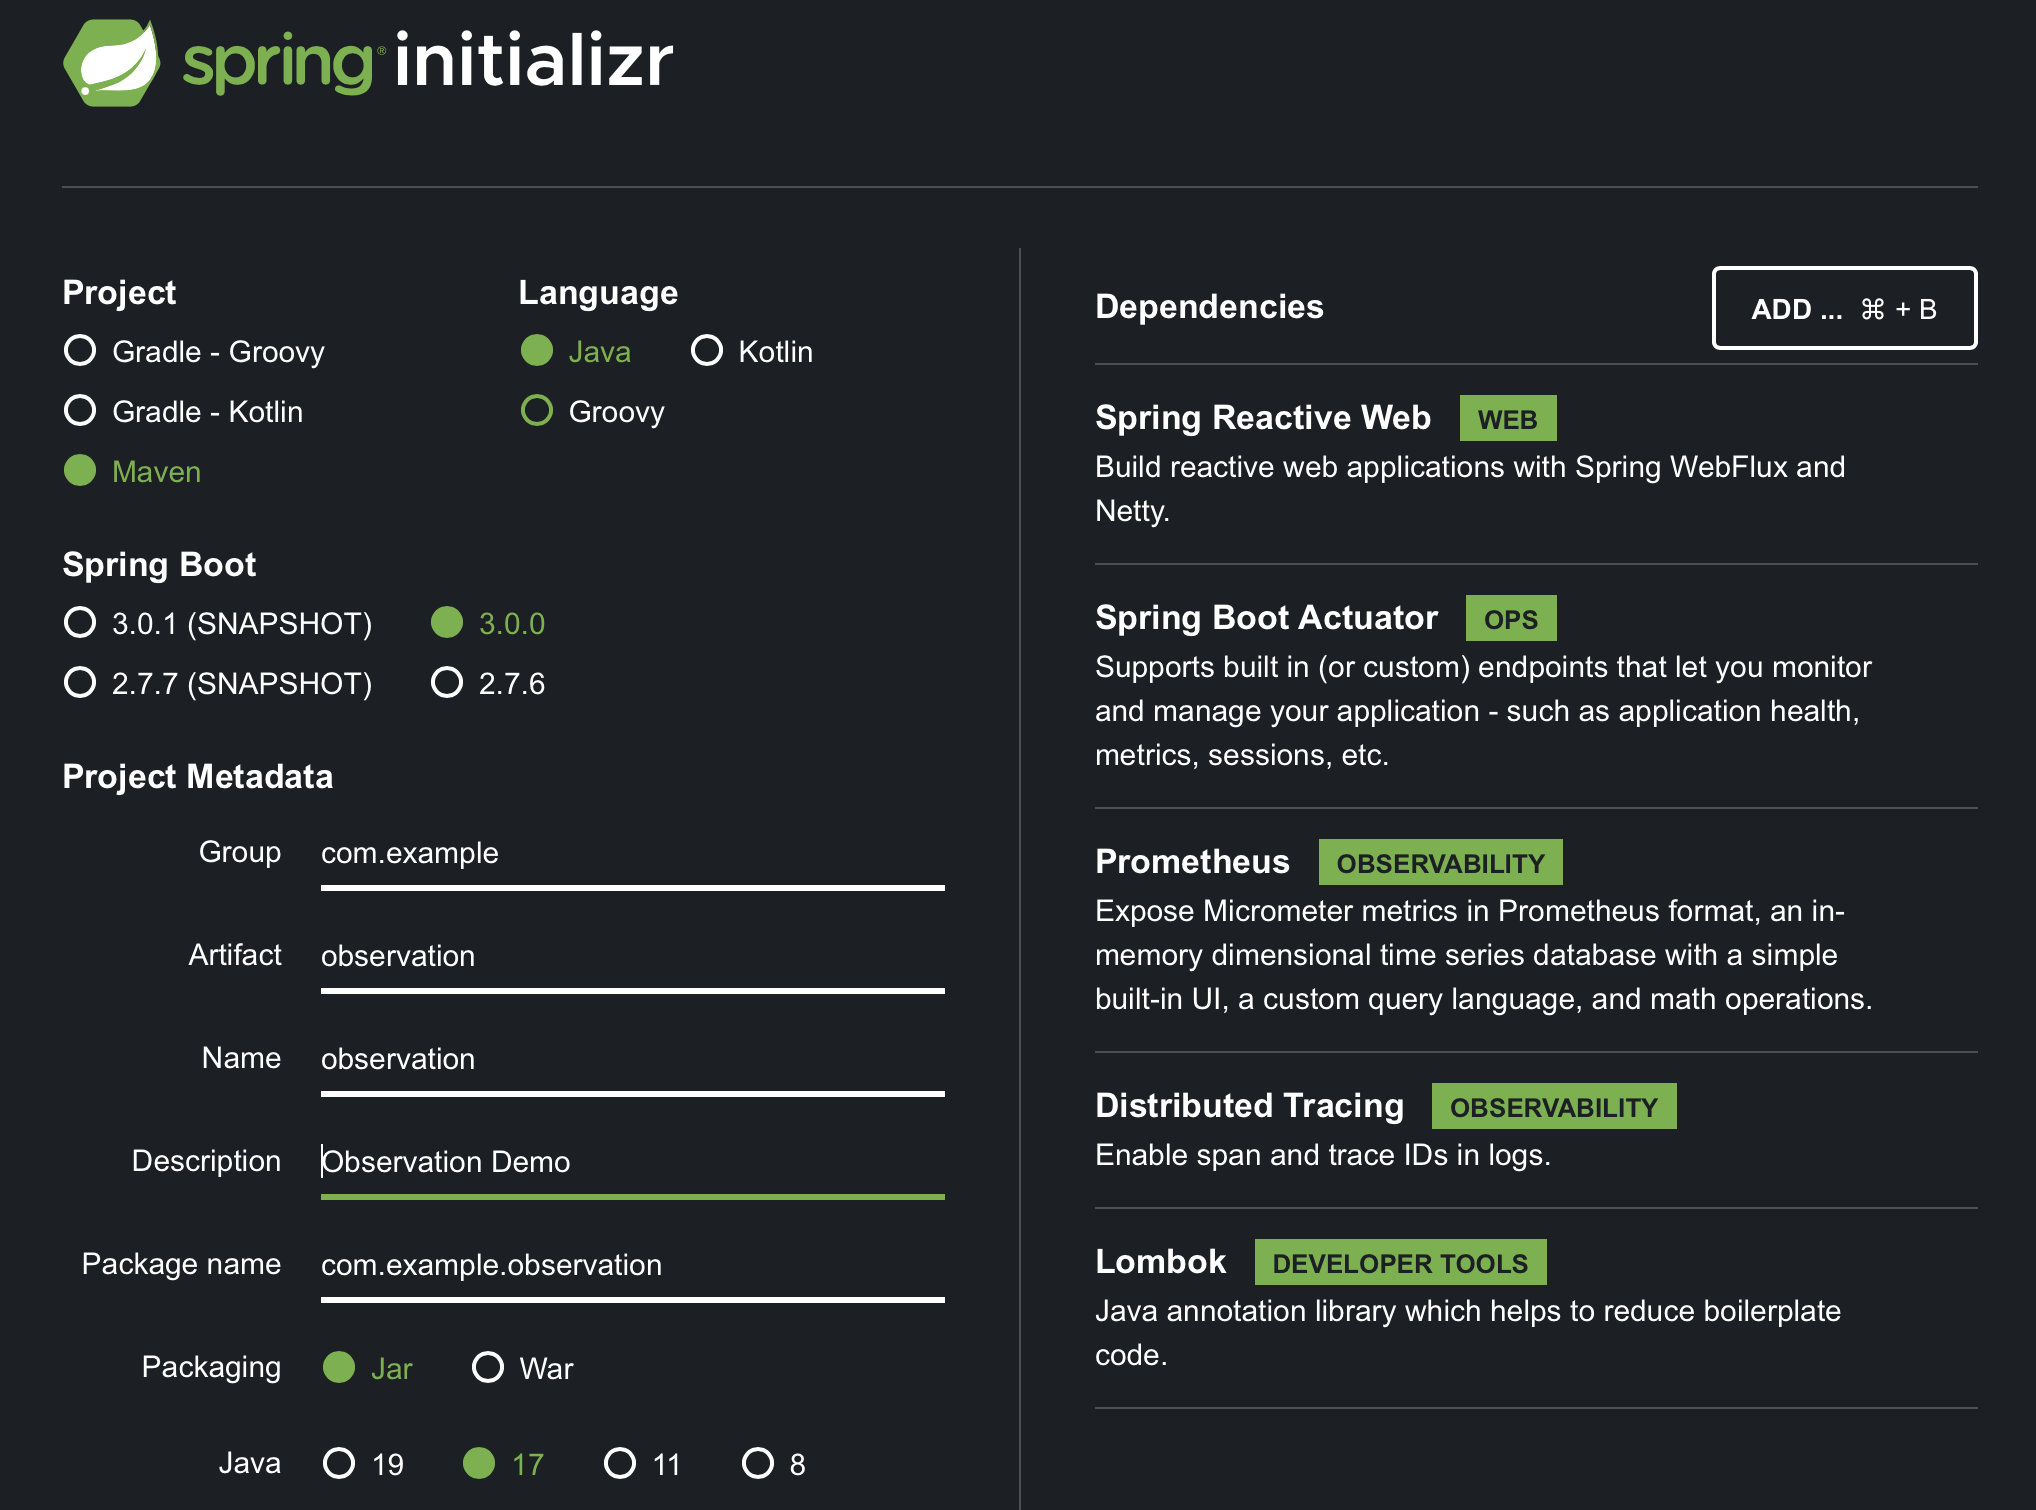
Let's create an HTTP Controller application. But, first, go to our second favorite website, the Spring Initializr - start dot spring dot io, and make the following selections:
Dependencies:
- Webflux
- Actuator
- Prometheus
- Distributed-tracing
- Lombok
Platform Version:
- 3.0.0
Packaging:
- Jar
JVM Version:
- 17
Type:
- Maven
Here is a screenshot (for reference) of what the configuration on start.spring.io looks like:
Alternatively, if you have the curl client installed, you can generate the same application from the command line:
curl -G https://start.spring.io/starter.zip -o observable.zip -d dependencies=webflux,actuator,prometheus,distributed-tracing,lombok -d packageName=com.example.observation \
-d description=Observation%20Demo -d type=maven-project -d language=java -d platformVersion=3.0.0 \
-d packaging=jar -d jvmVersion=17 -d groupId=com.example -d artifactId=observation -d name=observation
Open this project in your favorite IDE and follow along, or simply browse the source for reference. For clarification, you will add dependencies as this guide progresses.
Next, establish basic application properties: app name, server port, and logging format.
application.properties:
spring.application.name=test-service
server.port=8787
spring.main.web-application-type=reactive
logging.pattern.level=%5p [${spring.application.name:},%X{traceId:-},%X{spanId:-}]
A greeting service
The following sample creates an HTTP Controller that calls a service. In this example, we only return a specific payload: Greeting.
The payload is a simple record:
Greeting.java:
record Greeting(String name) {}
The service class uses a latency generator to add dimension to the latency graph seen later.
GreetingService.java:
@Service
class GreetingService {

  private final Supplier<Long> latency = () -> new Random().nextLong(500);

  private final ObservationRegistry registry;

  GreetingService(ObservationRegistry registry) {
    this.registry = registry;
  }

  public Mono<Greeting> greeting(String name) {
    Long lat = latency.get();
    return Mono.just(new Greeting(name)).delayElement(Duration.ofMillis(lat));
  }
}
Add a RestController endpoint
In this Controller, you will define a GetMapping that exposes an endpoint to return a greeting. The greeting will contain a name derived from the path parameter {name}:
@RestController
class GreetingController {
    private final GreetingService service;

    GreetingController(GreetingService service) {
        this.service = service;
    }

    @GetMapping("/hello/{name}")
    public Mono<Greeting> greeting(@PathVariable("name") String name) {
        return service
                .greeting(name);
    }
}
TIP: WebFluxObservationAutoConfiguration is the autoconfiguration class for observation in WebFlux. It includes all of the
ObservationHandlerandWebFilterinstances needed to observe (draw traces and meters from) HTTP requests and responses.
Reactive stream observation with reactor-core-micrometer
Project reactor comes with built-in support for Micrometer instrumentation implementations.
Use the reactive tap operator to instrument the streams in this sample. The tap operator uses a stateful per-subscription SignalListener to manage the state of the Observation in progress.
To get a micrometer signal listener, import the reactor-core-micrometer dependency. Note that this API also puls in the context-propagation library to propagate observability information along the lifetime of the reactive stream.
Here are the additions to pom.xml that enable Micrometer Reactive Stream integration:
<dependency>
	<groupId>io.projectreactor</groupId>
	<artifactId>reactor-core-micrometer</artifactId>
</dependency>
The reactor.core.observability.micrometer.Micrometer API provides the StreamListener to observe a stream. In addition, the StreamListener allows ObservationHandlers to respond to the observed lifecycle of a stream. This example observes the stream using the Micrometer.observation API that hooks into Micrometer's Observation framework.
Modify the GreetingService from earlier to use the Observation API:
return Mono
        .just(new Greeting(name))
        .delayElement(Duration.ofMillis(lat))
        .name("greeting.call")		//1
        .tag("latency", lat > 250 ? "high" : "low")	//2
        .tap(Micrometer.observation(registry));	//3
This block will track a span underneath the Rest Controller invocation. The main additions are as follows:
- Use
.nameto specify theObservationname. - Add low cardinality tags and attributes to the measurements with
.tag. The example latency string is either 'high' or 'low'. - Produce the
Observation-specific signal listener for thetapoperator. This operator covers the entire length of the reactive stream.
Read more about Micrometer Metrics in streams in the Micrometer Observation Docs.
Building an OSS observability stack
There are many pre-existing SAAS observability suites out there, of which VMWare's Wavefront is one good option. In addition, SAAS observability suites are easier to set up and integrate. But, in the interest of exploration, we're going to manually assemble a solution using open-source components: Tempo, Loki, Grafana, and Prometheus.
Next, configure a Grafana dashboard to view logs, traces, and metrics in one location. The following additional projects are required to get started:
- Prometheus - Metrics
- Loki - Log Aggregation
- Tempo - Trace Backend
- Grafana - Dashboard Visualization
There are pre-configured instances of Prometheus, Grafana, Tempo, and Loki located within the infra directory. Docker Compose scripts and server configuration files are provided in this directory. Bring the whole thing up with the following command:
cd infra/
docker compose up
This startup may take a minute or two since it may need to download images over the network. So have a few sips of that tea, coffee, or water you might have on hand! Next, move on and examine this infrastructure as it relates to the example app.
Prometheus Setup
On the application-facing side of Prometheus, you will configure a set of scrape configurations for ingesting the application's /actuator/prometheus endpoint.
The specific scrape configuration for the example application is listed below:
global:
  scrape_interval: 2s
  evaluation_interval: 2s

scrape_configs:
  - job_name: "prometheus"
    static_configs:
      - targets: ["host.docker.internal:9090"]
  - job_name: "apps"
    metrics_path: "/actuator/prometheus"
    static_configs:
      - targets: ["host.docker.internal:8787"]
Enable the Prometheus Actuator endpoint
Configure the application to expose the specific /actuator/prometheus endpoint used for Prometheus's scraping process:
In application.properties, add:
management.endpoints.web.exposure.include=prometheus
Micrometer supports publishing histograms for computing percentile distributions with the management.metrics.distribution.percentiles-histogram property. We can apply a per Meter customization to the WebFlux or MVC http.server.requests metrics and produce the target percentiles histogram as follows:
In application.properties, add:
management.metrics.distribution.percentiles-histogram.http.server.requests=true
NOTE: percentiles histograms are required for Prometheus Exemplars to function. Percentile histograms do not affect systems that do not support histogram-based percentile approximations.
Configure Loki log aggregation
Grafana queries Loki to add log correlation with traces and metrics. To apply this behavior to the application, configure a Logback appender to emit logs directly to Loki. This appender - com.github.loki4j.logback.Loki4jAppender - comes from Loki4J.
To make this work, use the loki-logback-appender dependency:
<dependency>
	<groupId>com.github.loki4j</groupId>
	<artifactId>loki-logback-appender</artifactId>
	<version>1.3.2</version>
</dependency>
Place logback-spring.xml into src/main/resources of the project and ensure the appender for Loki has the correct URL configured.
<?xml version="1.0" encoding="UTF-8"?>
<configuration>
    <include resource="org/springframework/boot/logging/logback/base.xml" />
    <springProperty scope="context" name="appName" source="spring.application.name"/>

    <appender name="LOKI" class="com.github.loki4j.logback.Loki4jAppender">
        <http>
            <url>http://localhost:3100/loki/api/v1/push</url>
        </http>
        <format>
            <label>
                <pattern>app=${appName},host=${HOSTNAME},traceID=%X{traceId:-NONE},level=%level</pattern>
            </label>
            <message>
                <pattern>${FILE_LOG_PATTERN}</pattern>
            </message>
            <sortByTime>true</sortByTime>
        </format>
    </appender>

    <root level="INFO">
        <appender-ref ref="LOKI"/>
    </root>
</configuration>
WARNING: For illustrative purposes, this log configuration includes the 'traceID' label representing many values. The Loki Doc states: "High cardinality causes Loki to build a huge index (read: expensive!) and to flush thousands of tiny chunks to the object store (read: slow).". Therefore, do not use this configuration in production.
Tempo configuration
This example uses Micrometer Tracing to ship trace data to Tempo. The Openzipkin Brave and Micrometer bridge for Brave ships the trace data to Tempo's Zipkin receiver.
Use local filesystem storage since provisioning block storage is a bit complex for this example.
The Zipkin receiver requires the default TCP port 9411 (Zipkin). This configuration uses the "Push with HTTP" option per Tempo documentation.
tempo-local.yaml:
server:
  http_listen_port: 3200

distributor:
  receivers:
    zipkin:

storage:
  trace:
    backend: local
    local:
      path: /tmp/tempo/blocks
Ensure every trace gets to Zipkin endpoints by adding the following lines to application.properties:
management.tracing.sampling.probability=1.0
Grafana dashboards
Grafana provisions external data with configuration from infra/docker/grafana/provisioning/datasources/datasource.yml. The following datasource configuration tells Grafana where to find each external source of data:
apiVersion: 1

datasources:
  - name: Prometheus
    type: prometheus
    access: proxy
    url: http://host.docker.internal:9090
    editable: false
    jsonData:
      httpMethod: POST
      exemplarTraceIdDestinations:
        - name: trace_id
          datasourceUid: "tempo"
  - name: Tempo
    type: tempo
    access: proxy
    orgId: 1
    url: http://tempo:3200
    basicAuth: false
    isDefault: true
    version: 1
    editable: false
    apiVersion: 1
    uid: tempo
    jsonData:
      httpMethod: GET
      tracesToLogs:
        datasourceUid: "loki"
  - name: Loki
    type: loki
    uid: loki
    access: proxy
    orgId: 1
    url: http://loki:3100
    basicAuth: false
    isDefault: false
    version: 1
    editable: false
    apiVersion: 1
    jsonData:
      derivedFields:
        - datasourceUid: "tempo"
          matcherRegex: \[.+,(.+?),
          name: TraceID
          url: $${__value.raw}
This dashboard configuration, located at infra/docker/grafana/provisioning/dashboards/logs_traces_metrics.json is called logs_traces_metrics. The code to this dashboard code was borrowed from the observability blog post on spring.io.
{
  "annotations":
    {
      "list":
        [
          {
            "builtIn": 1,
            "datasource": { "type": "grafana", "uid": "-- Grafana --" },
            "enable": true,
            "hide": true,
            "iconColor": "rgba(0, 211, 255, 1)",
            "name": "Annotations & Alerts",
            "target":
              {
                "limit": 100,
                "matchAny": false,
                "tags": [],
                "type": "dashboard",
              },
            "type": "dashboard",
          },
        ],
    },
  "editable": true,
  "fiscalYearStartMonth": 0,
  "graphTooltip": 0,
  "id": 6,
  "iteration": 1654517000502,
  "links": [],
  "liveNow": false,
  "panels":
    [
      {
        "datasource": { "type": "loki", "uid": "loki" },
        "description": "",
        "gridPos": { "h": 10, "w": 23, "x": 0, "y": 0 },
        "id": 2,
        "options":
          {
            "dedupStrategy": "none",
            "enableLogDetails": true,
            "prettifyLogMessage": true,
            "showCommonLabels": true,
            "showLabels": true,
            "showTime": true,
            "sortOrder": "Ascending",
            "wrapLogMessage": true,
          },
        "targets":
          [
            {
              "datasource": { "type": "loki", "uid": "loki" },
              "editorMode": "builder",
              "expr": '{traceID="$traceID"}',
              "queryType": "range",
              "refId": "A",
            },
          ],
        "title": "Logs with trace ID $traceID",
        "type": "logs",
      },
      {
        "datasource": { "type": "tempo", "uid": "tempo" },
        "description": "",
        "gridPos": { "h": 15, "w": 23, "x": 0, "y": 10 },
        "id": 6,
        "targets":
          [
            {
              "datasource": { "type": "tempo", "uid": "tempo" },
              "query": "$traceID",
              "queryType": "traceId",
              "refId": "A",
            },
          ],
        "title": "Trace View for trace with id $traceID",
        "type": "traces",
      },
      {
        "datasource": { "type": "prometheus", "uid": "PBFA97CFB590B2093" },
        "fieldConfig":
          {
            "defaults":
              {
                "color": { "mode": "palette-classic" },
                "custom":
                  {
                    "axisLabel": "",
                    "axisPlacement": "auto",
                    "barAlignment": 0,
                    "drawStyle": "line",
                    "fillOpacity": 0,
                    "gradientMode": "none",
                    "hideFrom":
                      { "legend": false, "tooltip": false, "viz": false },
                    "lineInterpolation": "linear",
                    "lineWidth": 1,
                    "pointSize": 5,
                    "scaleDistribution": { "type": "linear" },
                    "showPoints": "auto",
                    "spanNulls": false,
                    "stacking": { "group": "A", "mode": "none" },
                    "thresholdsStyle": { "mode": "off" },
                  },
                "mappings": [],
                "thresholds":
                  {
                    "mode": "absolute",
                    "steps":
                      [
                        { "color": "green", "value": null },
                        { "color": "red", "value": 80 },
                      ],
                  },
                "unit": "s",
              },
            "overrides": [],
          },
        "gridPos": { "h": 10, "w": 23, "x": 0, "y": 25 },
        "id": 4,
        "options":
          {
            "legend":
              { "calcs": [], "displayMode": "list", "placement": "bottom" },
            "tooltip": { "mode": "single", "sort": "none" },
          },
        "targets":
          [
            {
              "datasource":
                { "type": "prometheus", "uid": "PBFA97CFB590B2093" },
              "editorMode": "code",
              "exemplar": true,
              "expr": 'histogram_quantile(1.00, sum(rate(http_server_requests_seconds_bucket{uri=~".*"}[$__rate_interval])) by (le))',
              "legendFormat": "max",
              "range": true,
              "refId": "A",
            },
            {
              "datasource":
                { "type": "prometheus", "uid": "PBFA97CFB590B2093" },
              "editorMode": "code",
              "exemplar": true,
              "expr": 'histogram_quantile(0.99, sum(rate(http_server_requests_seconds_bucket{uri=~".*"}[$__rate_interval])) by (le))',
              "hide": false,
              "legendFormat": "tp99",
              "range": true,
              "refId": "B",
            },
            {
              "datasource":
                { "type": "prometheus", "uid": "PBFA97CFB590B2093" },
              "editorMode": "code",
              "exemplar": true,
              "expr": 'histogram_quantile(0.95, sum(rate(http_server_requests_seconds_bucket{uri=~".*"}[$__rate_interval])) by (le))',
              "hide": false,
              "legendFormat": "tp95",
              "range": true,
              "refId": "C",
            },
          ],
        "title": "latency for All",
        "type": "timeseries",
      },
    ],
  "schemaVersion": 36,
  "style": "dark",
  "tags": [],
  "templating":
    {
      "list":
        [
          {
            "current":
              {
                "selected": false,
                "text": "0003776c79e02b6c",
                "value": "0003776c79e02b6c",
              },
            "datasource": { "type": "loki", "uid": "loki" },
            "definition": "label_values(traceID)",
            "hide": 0,
            "includeAll": false,
            "label": "Trace ID",
            "multi": false,
            "name": "traceID",
            "options": [],
            "query": "label_values(traceID)",
            "refresh": 1,
            "regex": "",
            "skipUrlSync": false,
            "sort": 0,
            "type": "query",
          },
        ],
    },
  "time": { "from": "now-15m", "to": "now" },
  "timepicker": {},
  "timezone": "",
  "title": "Logs, Traces, Metrics",
  "uid": "szVLMe97z",
  "version": 7,
  "weekStart": "",
}
Observing the WebFlux Application
Execute the application as-is:
mvn spring-boot:run
Prometheus scrapes the /actuator/prometheus endpoint, populating metrics when the application runs. Generate traffic to the application by executing this script:
while true; do http :8787/hello/spring-boot-3 ; sleep 1; done
Run that on your local Unix-compatible shell. You could use tools like ab alternatively. This script uses curl to call the /hello endpoint every second. Allow it to run for a minute or two so Prometheus can collect metrics. Go to http://localhost:3000/dashboards and select General, then select the Logs, Traces, Metrics dashboard. You will see a screen resembling the following:
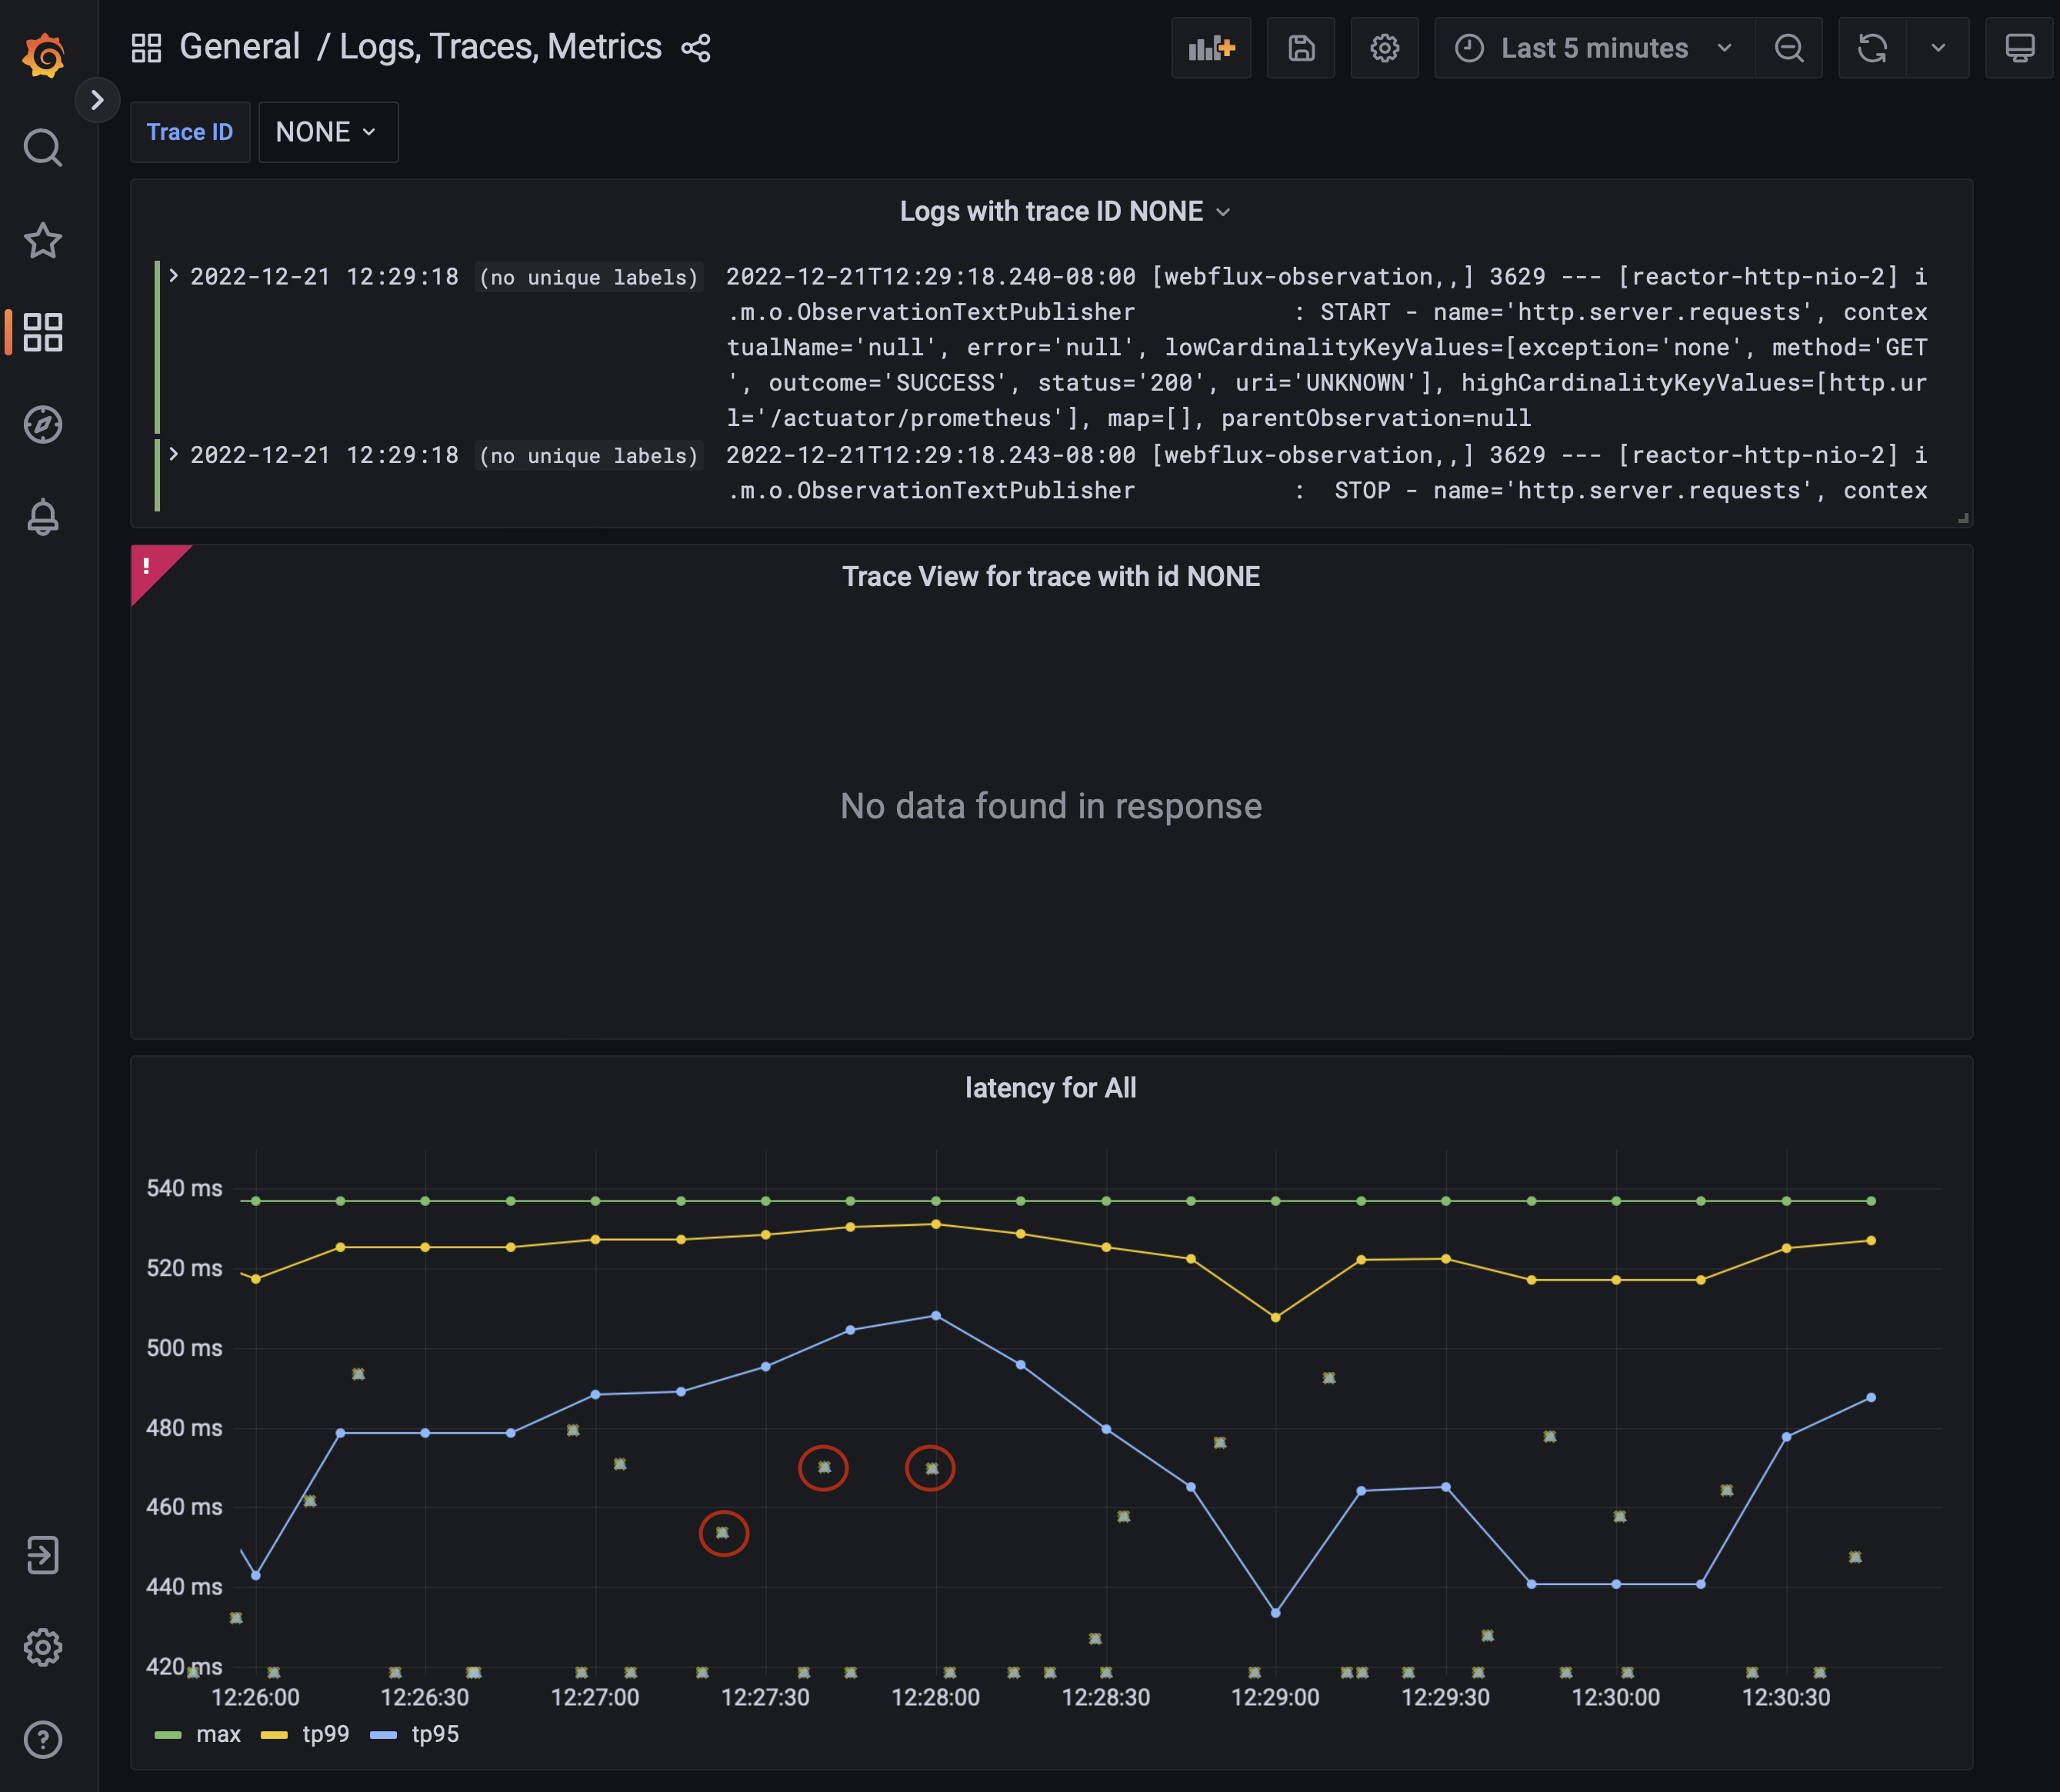
Look under 'latency for all' to see the observed latencies. There are free-floating yellow/green X's, some are circled in red - these are the Prometheus Exemplars correlating metrics with traces. The Prometheus Exemplar data is located by hovering over an 'X' and revealing the Exemplar view box.
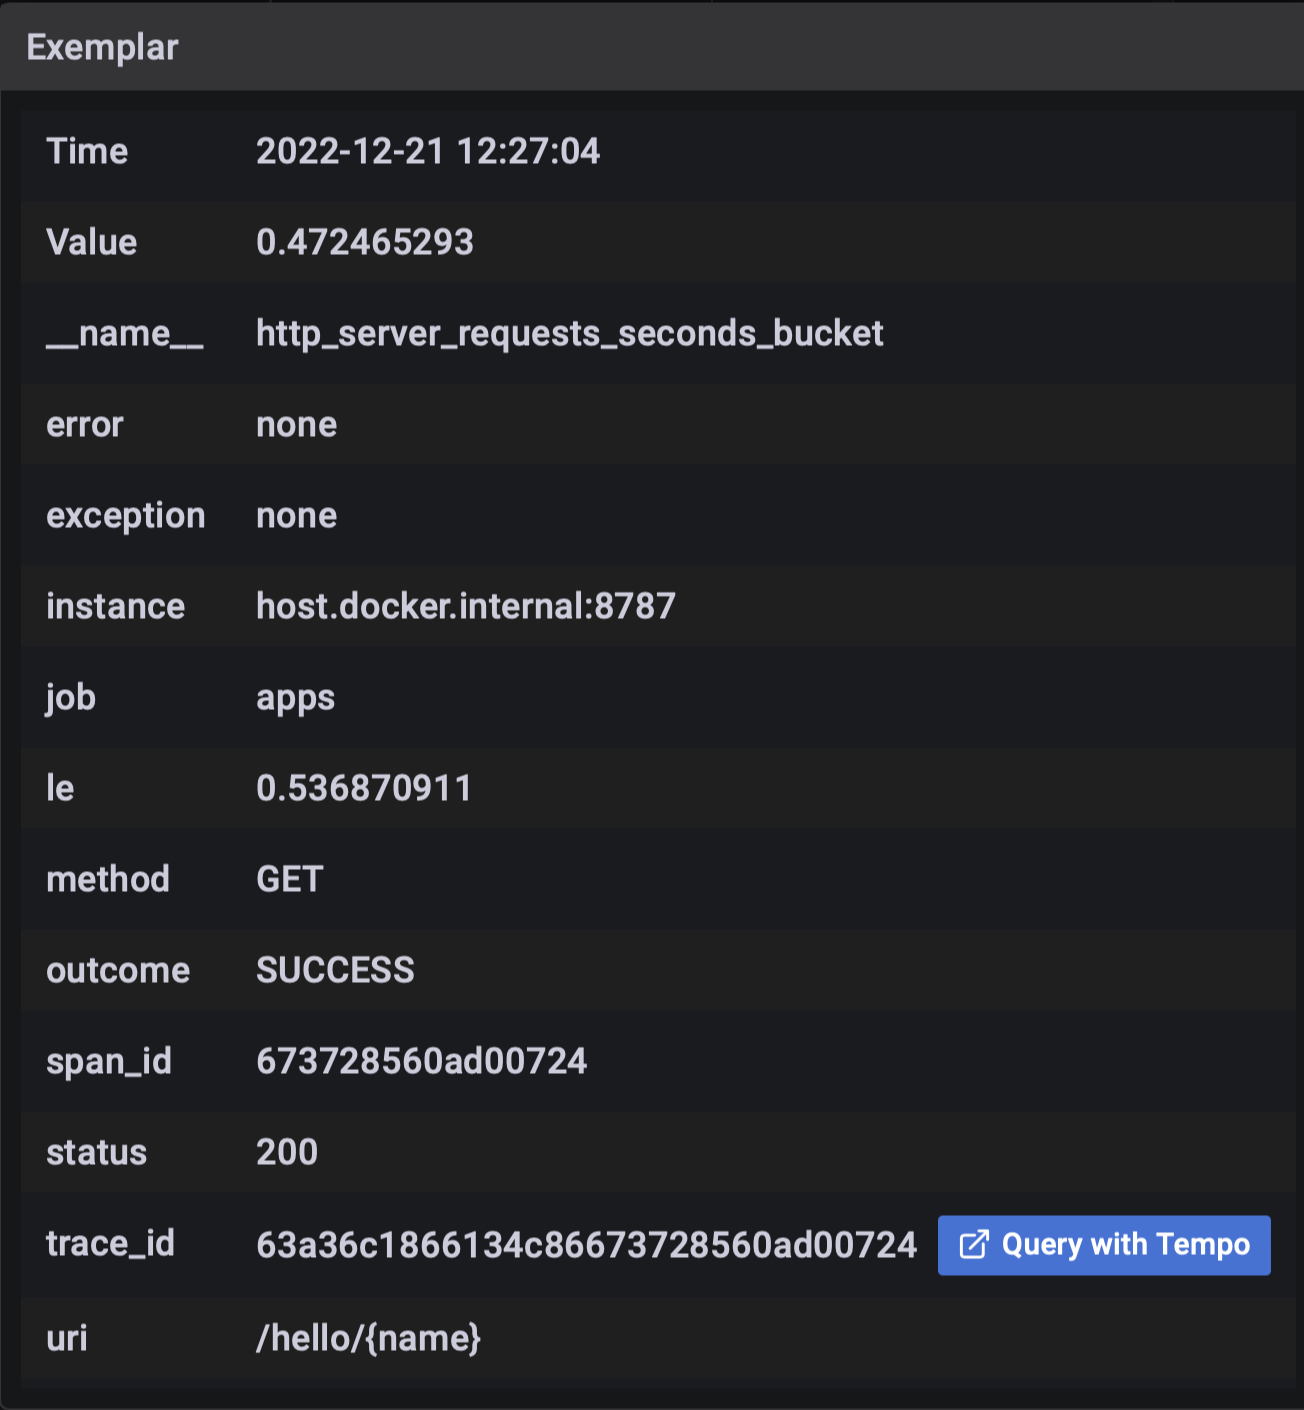
Rather than clicking 'Query with Tempo,' enter a trace ID in the text box labeled 'Trace ID' to reveal logs and traces correlated to that trace ID.
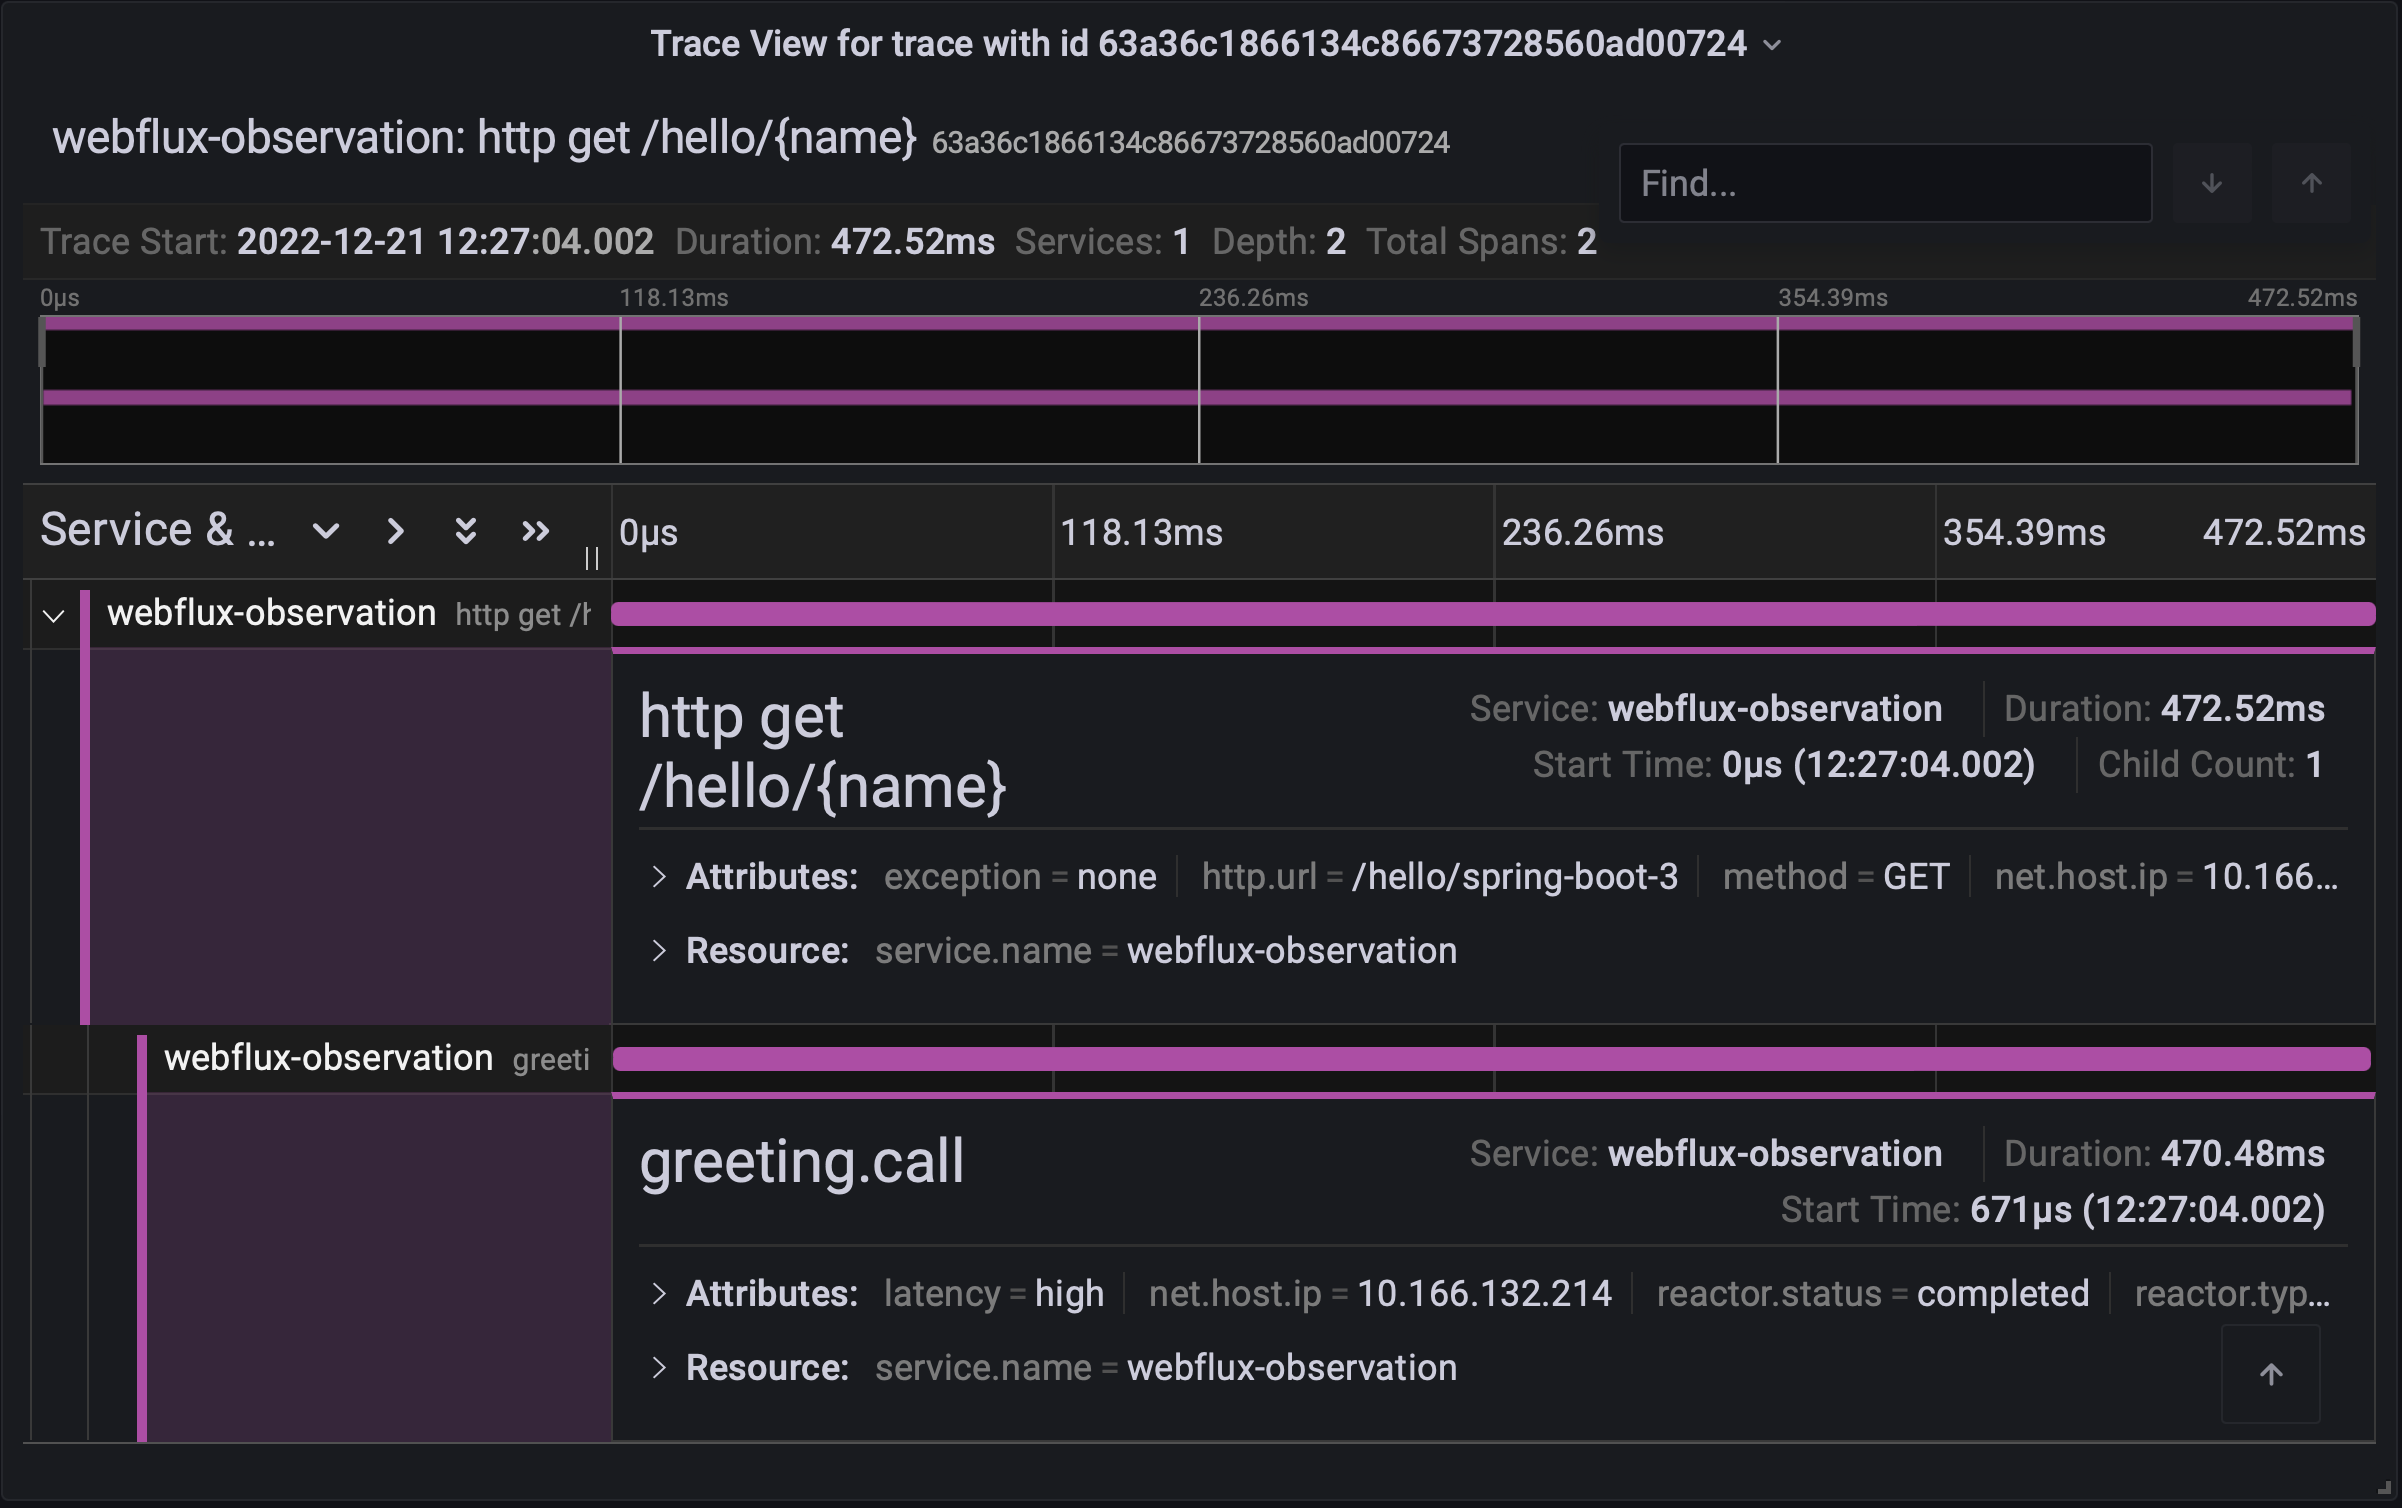
The 'Trace View' panel displays trace details correlated by the searched trace ID. The 'Logs with trace ID' panel displays logs having that trace ID.
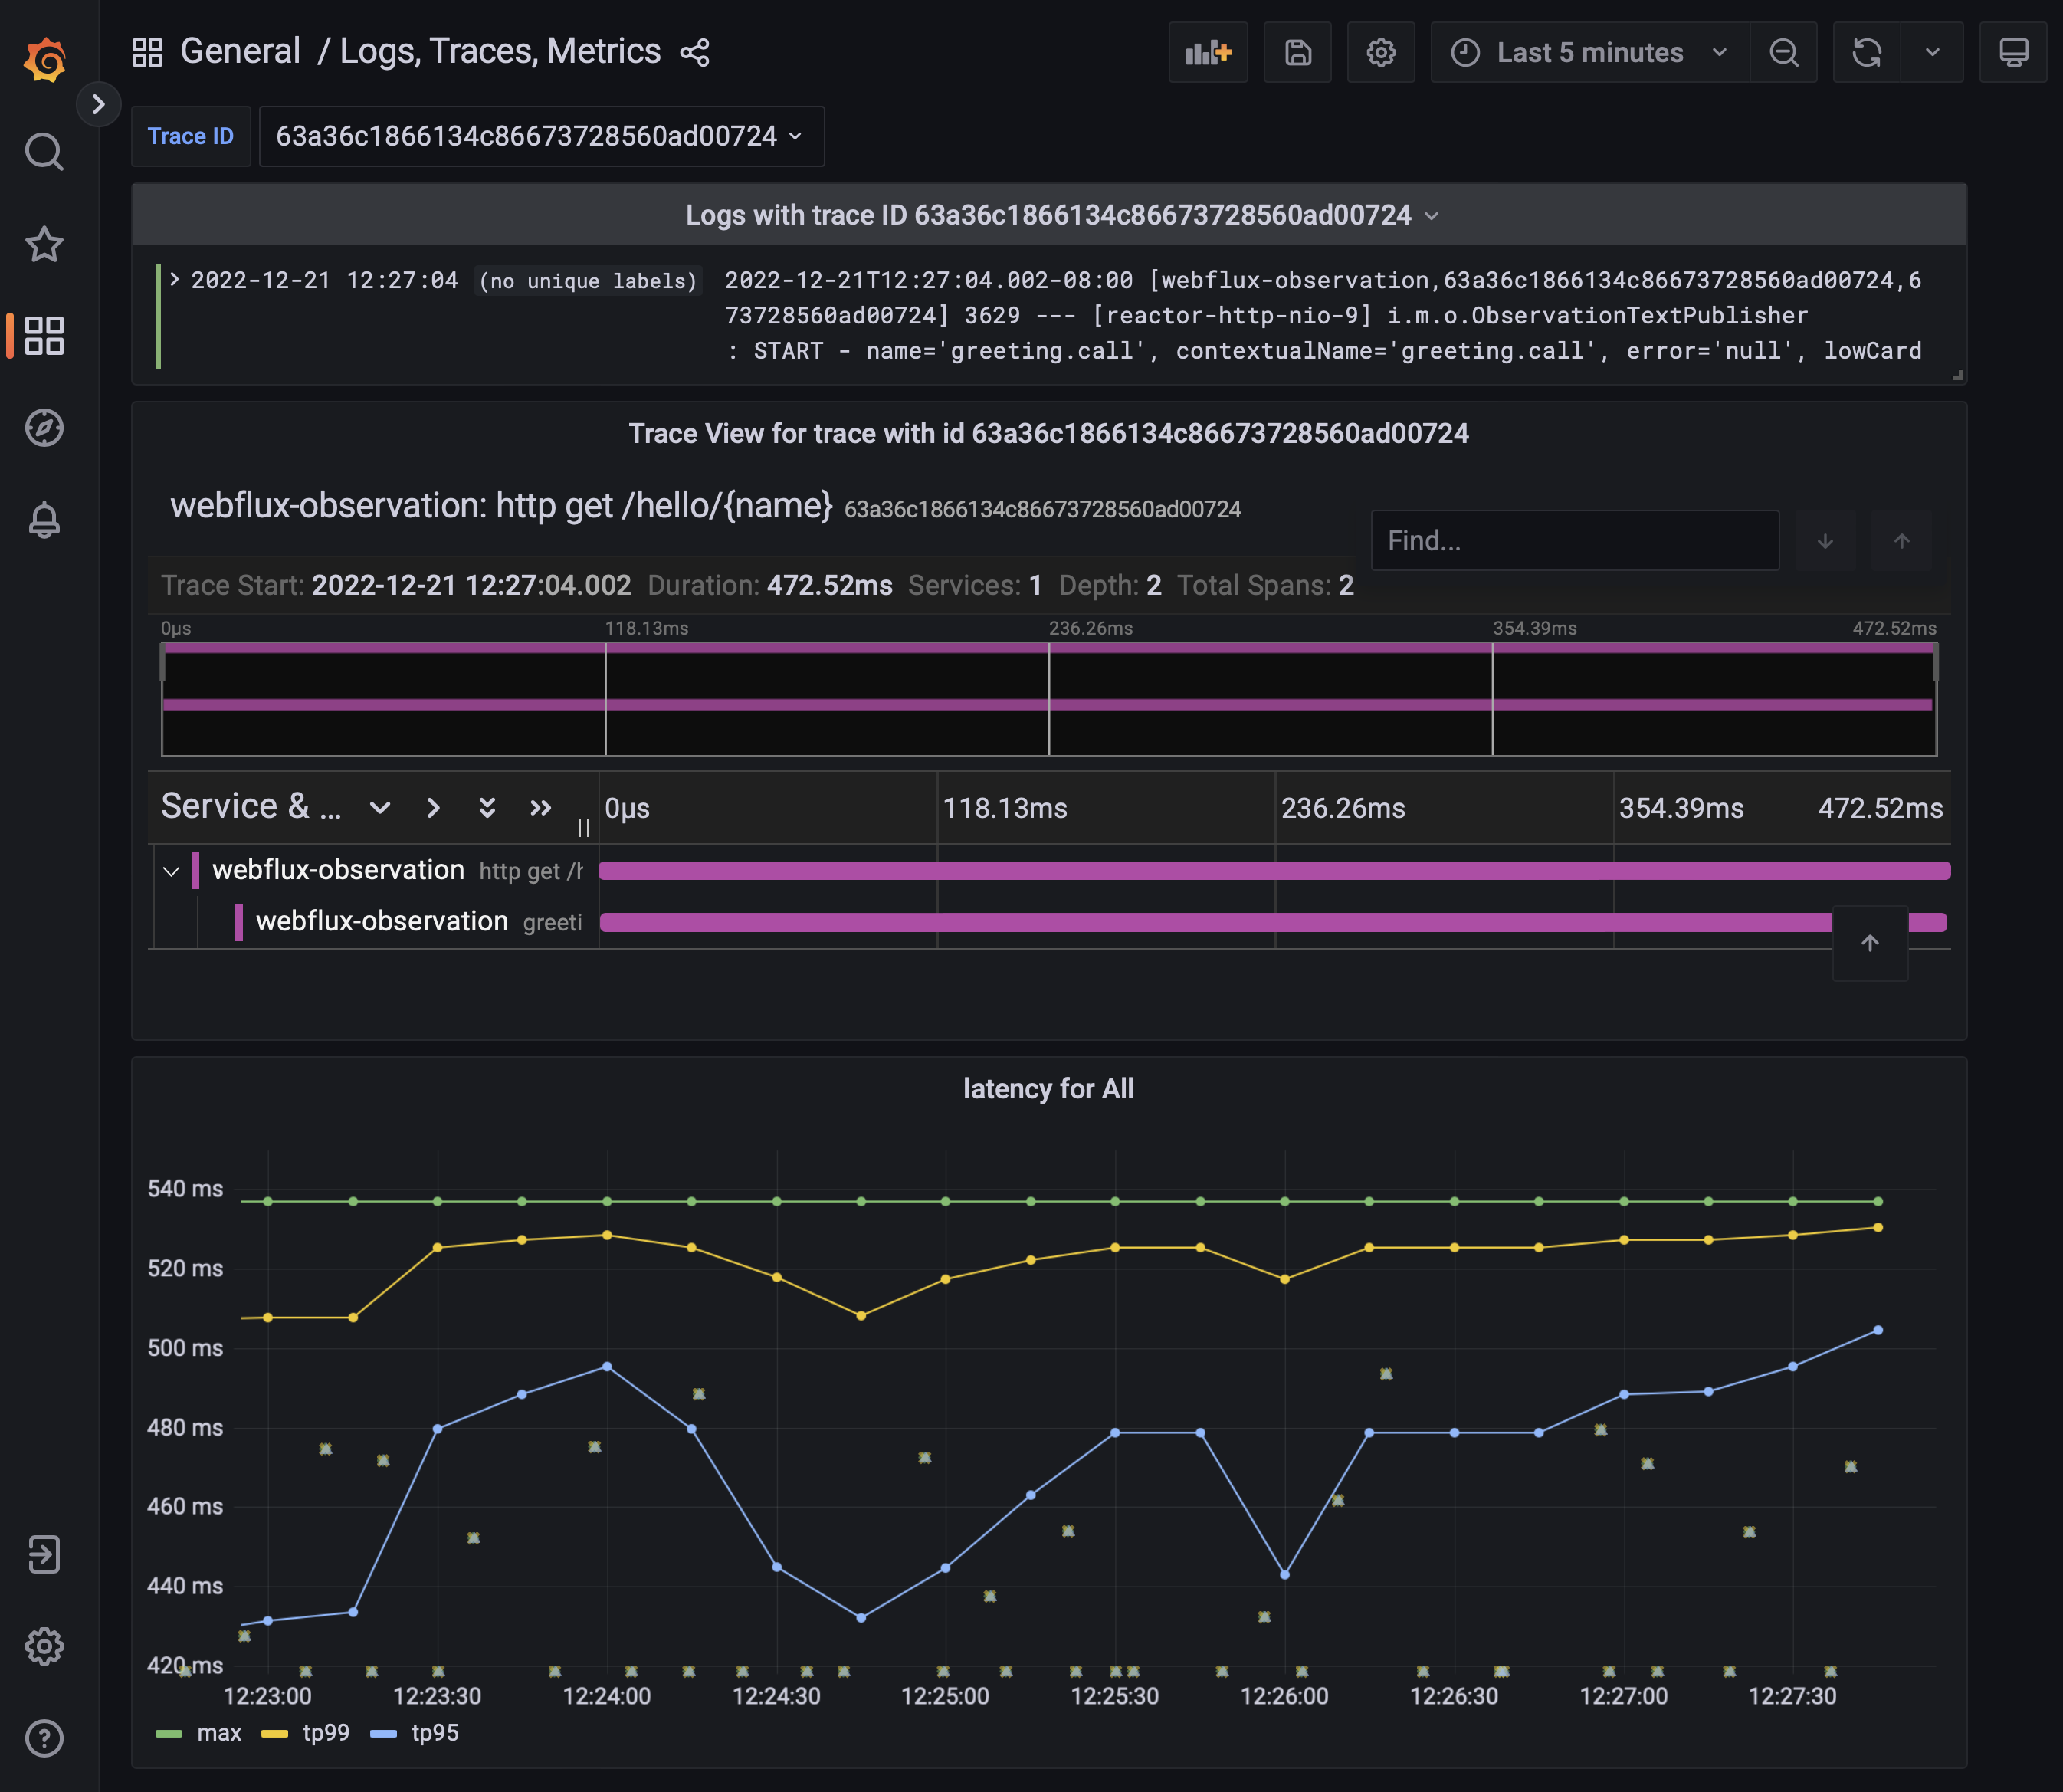
Finally, we can see that the Greeting service call has its distinct span tied to the parent HTTP request.
Conclusion
You configured a Spring Boot 3 reactive application with Micrometer. You learned how Micrometer 'observes' method calls and Reactive stream subscriptions to derive metric and trace data. An Open Source dashboard stack allows us to demonstrate the effectiveness of this configuration. Micrometer now supports both metrics and traces. In addition, you integrated Prometheus Exemplars.
Links and Readings
- Spring Boot Actuator Reference
- Micrometer Docs
- Prometheus Docs
- Grafana Tempo Docs
- Grafana Loki Docs
- Grafana Docs
- When to use the Pushgateway?
- Observability in Spring Boot 3 write-up
- Exposing Reactor metrics with Micrometer
- Observability Migration from Sleuth
- Reactor - Contextual Logging Pattern
- Tempo configuration
Summary
This guide was originally authored by Mario Gray
Give Feedback
Help us improve by sharing your thoughts.