

Jenkins is a widely used automation platform for building and testing software projects. It allows DevOps teams to make changes to their projects more efficiently helping them ship code faster. When you develop and push code to production in the cloud-native environment, the performance of your build pipeline can affect the velocity of your code updates. For example, if you have issues with Jenkins queues, this can delay pushing code to your production clusters and delay deployment which can impact your customers. This is where having telemetry to provide visibility into your Jenkins pipelines is critical.
We have recently updated our Wavefront Jenkins Integration. It collects essential metrics from Jenkins systems and delivers pre-packaged dashboards that Jenkins admins, developers, and DevOps teams can use to help them monitor the health of their Jenkins environments.
Wavefront Metrics Provide Quick Snapshot of Jenkins Health
Check out the prebuilt Wavefront Jenkins dashboard below:
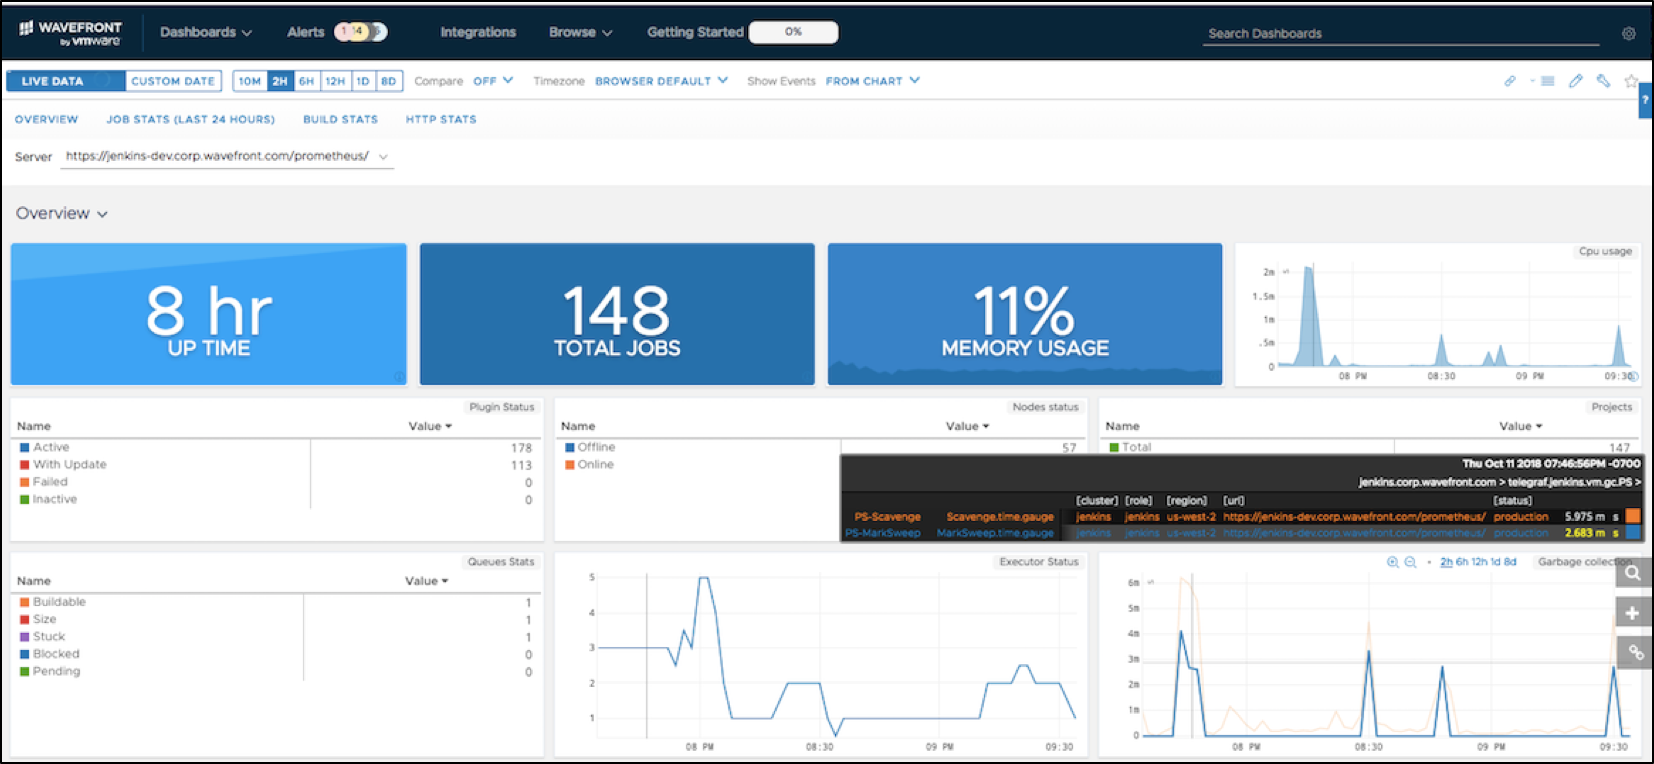
Ops teams and developers can understand key Jenkins KPIs including:
-
- Uptime
- Total Jobs
- Memory Usage
- CPU Usage
- Jenkins Job Status
- Jenkins Queue Stats
- Nodes Status
- Projects Stats
- Executor Status
- Garbage Collection
- Number of Successful Runs
- Number of Failed Runs
- Number of Unstable Runs
- Build Stats (Duration, Build Succeded, Build Running, Build Failed)
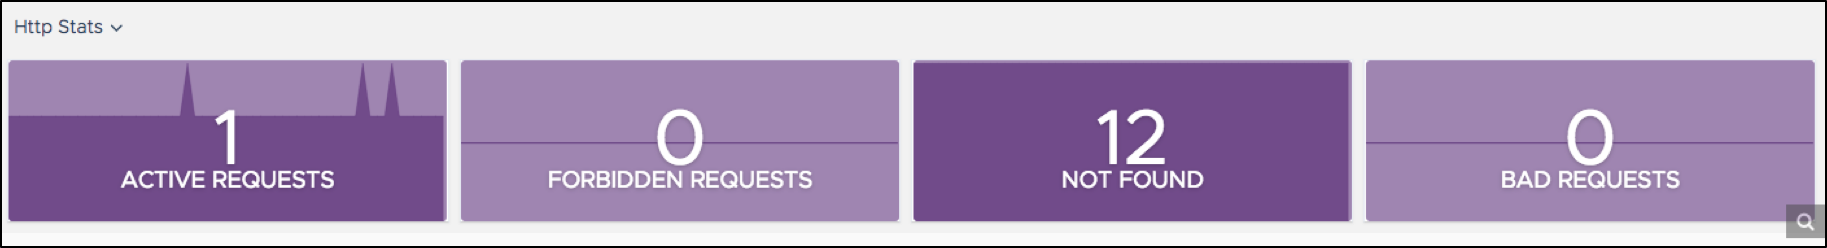
- Http Stats (Active Requests, Forbidden Requests, Not Found, Bad requests)
What can you do with these metrics? You can either use them as is, or add new ones using the Wavefront Query Language. You can also integrate and correlate them with your other important metrics such as Puppet or GitHub metrics. Below are some examples of value you can get from our Jenkins integration.
Build Stats Deliver Key Insights for Developers
Developers can use the Build Stats charts – the Failed Build, Build Duration and Number of Builds Running to get a status update on the state of their builds. For example, following Build Duration metrics over time can help you see long-term trends across development projects, useful for both developers and QA teams. As well, the developer who initiated a build can get alerted about a failed build using Wavefront’s smart alert analytics. The failed build alert could initiate a ticket to JIRA as a feedback loop back to the developer. Check out Wavefront’s alert target functionality for further details.
Wavefront Alerting Drives Automation for DevOps Teams
The Overview charts from our integration provide handy Jenkins health information to Ops engineers who manage Jenkins clusters with a quick view into CPU and memory usage as well as Node Status info. Admins can easily understand if the node is online or offline. Or they can look at job queuing duration metrics relative to node counts and node online/offline history metrics. With the help of Wavefront alerts based on Jenkins metrics, DevOps engineers can use event-driven automation tools such as Stackstorm and execute the set of configuration steps to programmatically maintain the healthy state of their Jenkins environment. For instance, if the memory utilization on a Jenkins slave drops below a certain level, the alert- driven script may take a Jenkins slave offline avoiding manual intervention.
Moreover, monitoring CPU usage relative to Executor Status over time can be useful for Jenkins admins to understand if a particular Jenkins instance is in good health. That’s because you probably want check-ins to deploy as soon possible in production, which is essential for cloud-native environments, to minimize queuing. This is where Wavefront insight into Queuing Duration is vital for both admins and developers.
Further, HTTP Stats provide valuable insight into the activity of Jenkins users helping admins assess whether Jenkins is up or down or if there are potential security issues.
As a result of the described Wavefront telemetry-driven feedback loop, all engineering teams have visibility into their Jenkins environment driving rapid productivity increases and keeping up with the demands of customers.
Summary
There are ample Jenkins knobs exposed by Wavefront helping you see and troubleshoot Jenkins deployments from all different angles. Adapt your analytics tool to your own angle. Try Wavefront.
Get Started with Wavefront Follow @stela_udo Follow @WavefrontHQThe post Unclog Your Build Pipeline: Monitoring Jenkins Environment with Wavefront appeared first on Wavefront by VMware.
About the Author
Follow on Twitter Follow on Linkedin More Content by Stela Udovicic


