Pivotal Application Service (PAS) is based on Pivotal Cloud Foundry (PCF). With PAS on PCF DevOps and developer teams run their cloud applications on any infrastructure – AWS, Azure, GCP, vSphere, OpenStack or other cloud environments – without worrying about the underlying cloud infrastructure complexities. As the cloud application workload fluctuates, PAS on PCF easily scales and handles traffic changes elastically with no modifications to the application. As PAS runs applications, PCF infrastructure components generate metrics and logs that are aggregated into the usable structured form, e.g., Loggregator Firehouse telemetry.
These components also range from host virtual machines (VM) and applications to external dependencies such as databases and messaging systems. By applying PAS/PCF “nozzles”, the Firehose output can be directed to a monitoring system (Wavefront by VMware ) for analyzing user behavior, triggering alerts and troubleshooting by correlating applications to their PCF components and VMs. This blog further details PAS and underlying PCF metrics monitoring with Wavefront and Wavefront’s PAS/PCF integration for both PCF operators and developers.
Get Packaged Real-Time Insight into the PAS on PCF Performance
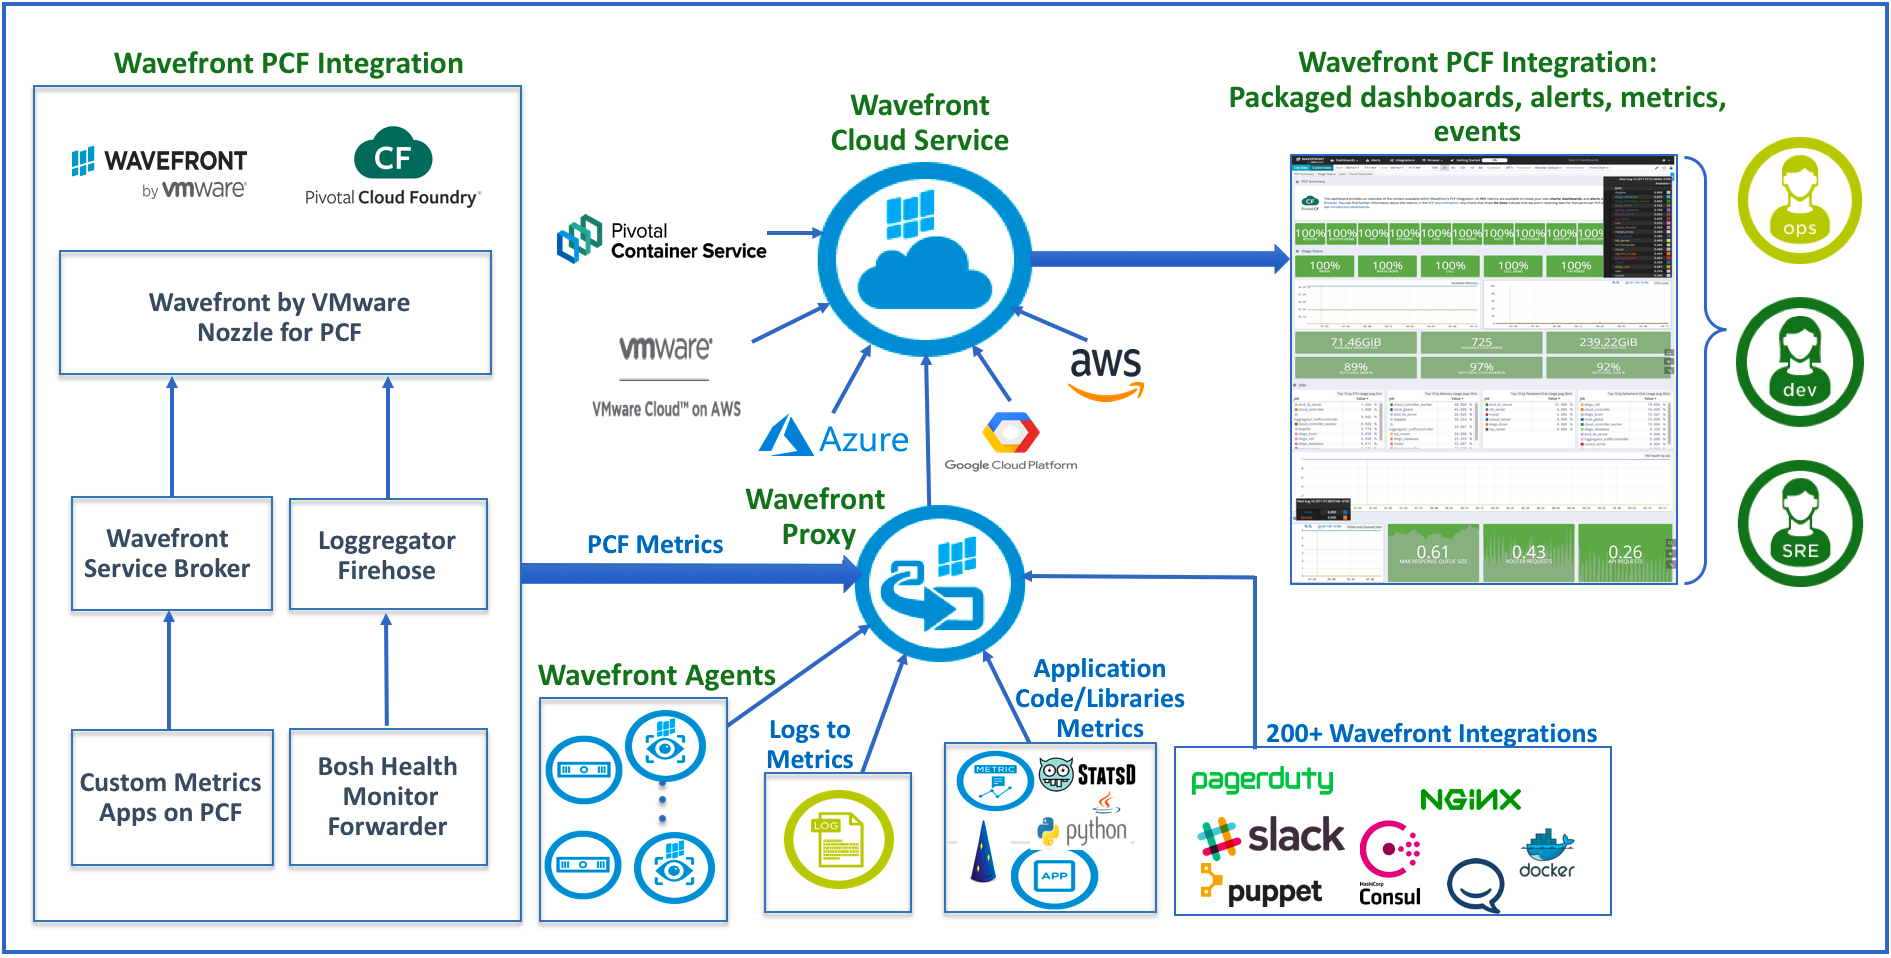
The Wavefront cloud-native analytics platform delivers out-of-the-box visibility for PAS and underlying PCF environments: VMs, cluster components, and cloud services. Using the Wavefront Nozzle for PAS/PCF to collect PAS and PCF metrics from components and services, PCF operators can efficiently monitor and optimize the PCF platform and applications running on top (see Figure 1). Wavefront provides shareable, self-service metrics for PCF operations, DevOps and PAS developer teams. Using the health overview dashboards, they can see quickly if the entire PAS on PCF environment is healthy and then dive into any individual component that is showing a degradation.
Wavefront helps PAS admin, PCF operators, and developers to:
- Deliver and monitor cloud services faster by understanding the health of the entire PAS on PCF environment using pre-built, analytics-driven dashboards with applications metrics
- Troubleshoot and resolve any PCF component issues with real-time system performance metrics
- Utilize packaged PCF alerts, or create customized ones using the Wavefront Query Language
- Trend and retain all PAS and PCF metrics for historical trend analysis and proactive capacity planning
 Figure 1. Wavefront PAS/PCF Integration
Essential Metrics Collected from the Entire PAS on PCF Environment
Wavefront provides many PAS on PCF health and performance metrics. Metrics are collected, analyzed and visualized by the Wavefront PAS/PCF Nozzle from key PCF components including:
- GoRouter (routes traffic from the application users to the VMs) – metrics for tracking overall incoming traffic such as requests latencies by application components, 4xx and 5xx HTTP server error response counts
- User Account and Authentication (UAA) – metrics for overall request throughput
- Diego Bulletin Board System (monitors Diego, i.e. PAS on PCF container orchestrator cluster state) – metrics for BBS request processing such as latencies, long-running process (LRP) and task counts
- Doppler Server (one of 3 Loggregator components – Metron Agent, Doppler Server, Traffic Controller – that aggregates, and buffers messages received from Metron Agents) – metrics for tracking the volume and rates of sent, dropped and received messages
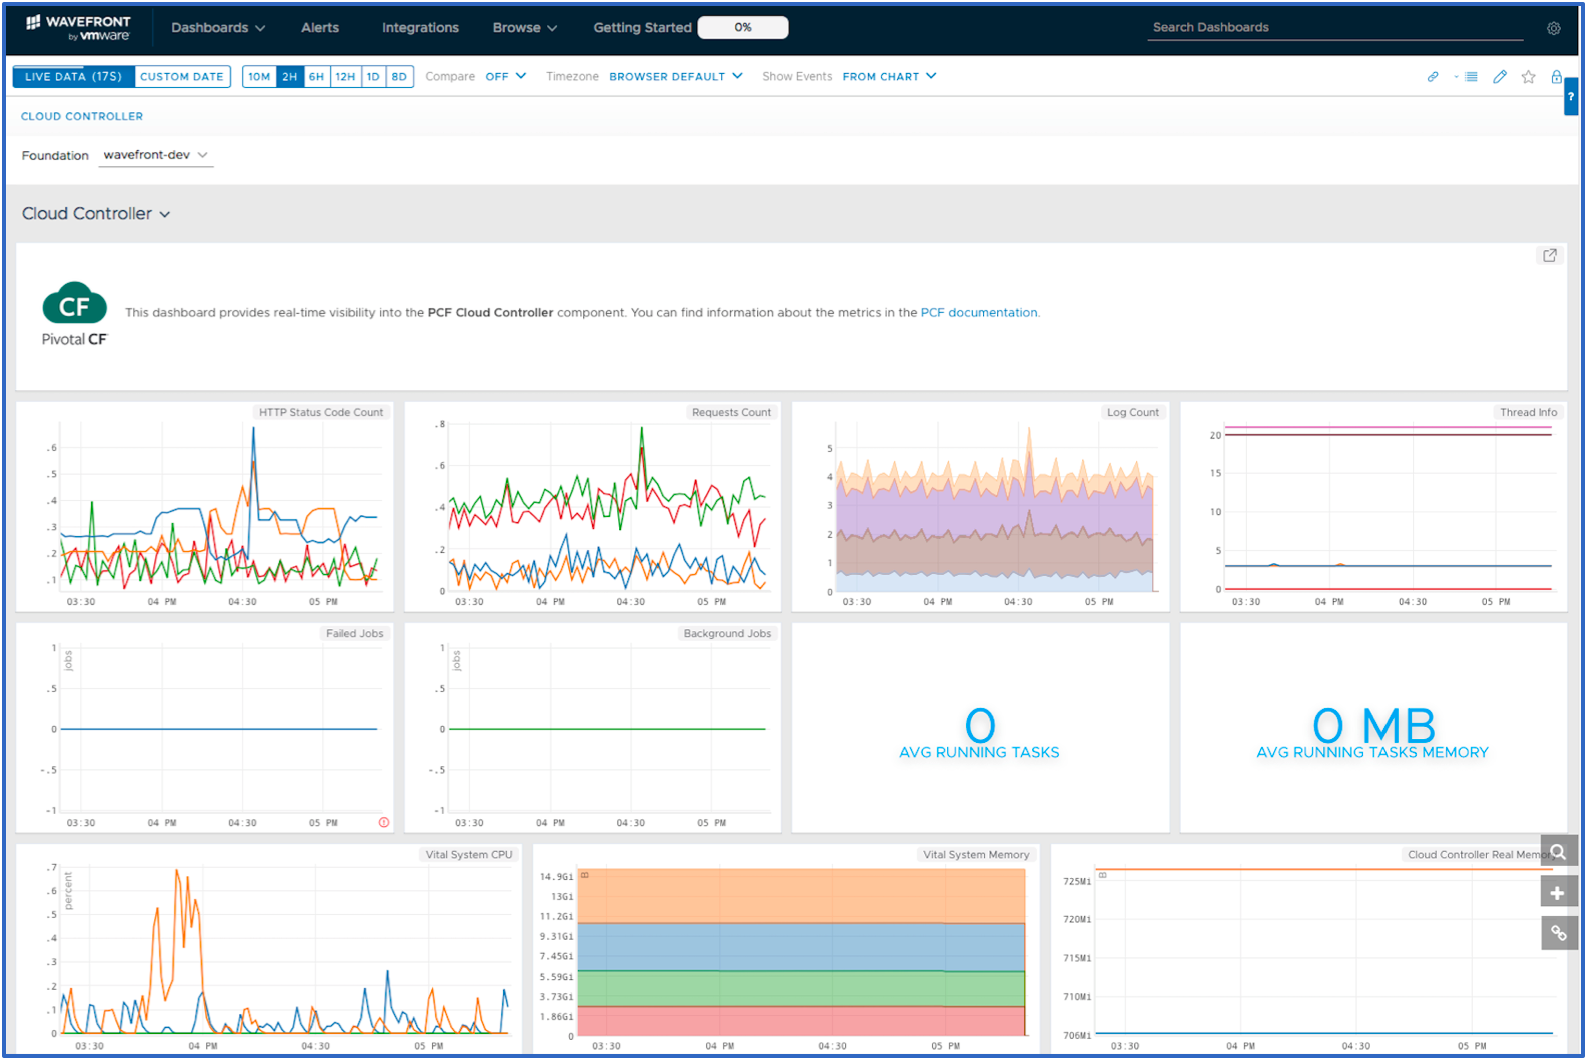
- Cloud Controller (runs the applications and processes on the cloud’s VMs) – metrics for tracking the volume and status of application tasks and jobs (see Figure 2.)
 Figure 2. Wavefront Dashboard for PCF on PCF Cloud Controller
With more profound insights, cloud operators can detect, resolve and remediate any PAS on PCF resource consumption bottleneck and see errors sooner, at any scale. The Wavefront prepackaged dashboards deliver full views of the overall health of the PCF platform, plus in-depth granular PCF component metrics and detailed container metrics. For the full list of PAS and PCF metrics and dashboards, see the Wavefront datasheet here or use the Wavefront PAS/PCF integration. You can sign up for a free trial if you take Wavefront on a test drive immediately.
Use Case – Resource Visibility for PCF Operators
PCF operators need continuous visibility at scale into PAS production performance. As a result, they can maintain agile code delivery and detect cloud resource anomalies early. One of the main benefits of PAS is that it enables developers to deploy PAS applications continuously. Using Wavefront dashboards, PCF operators can avoid capacity bottlenecks stemming from new code pushes, get insight into how many PAS on PCF containers can be created based on the overall memory usage, and adjusts memory to meet requirements.
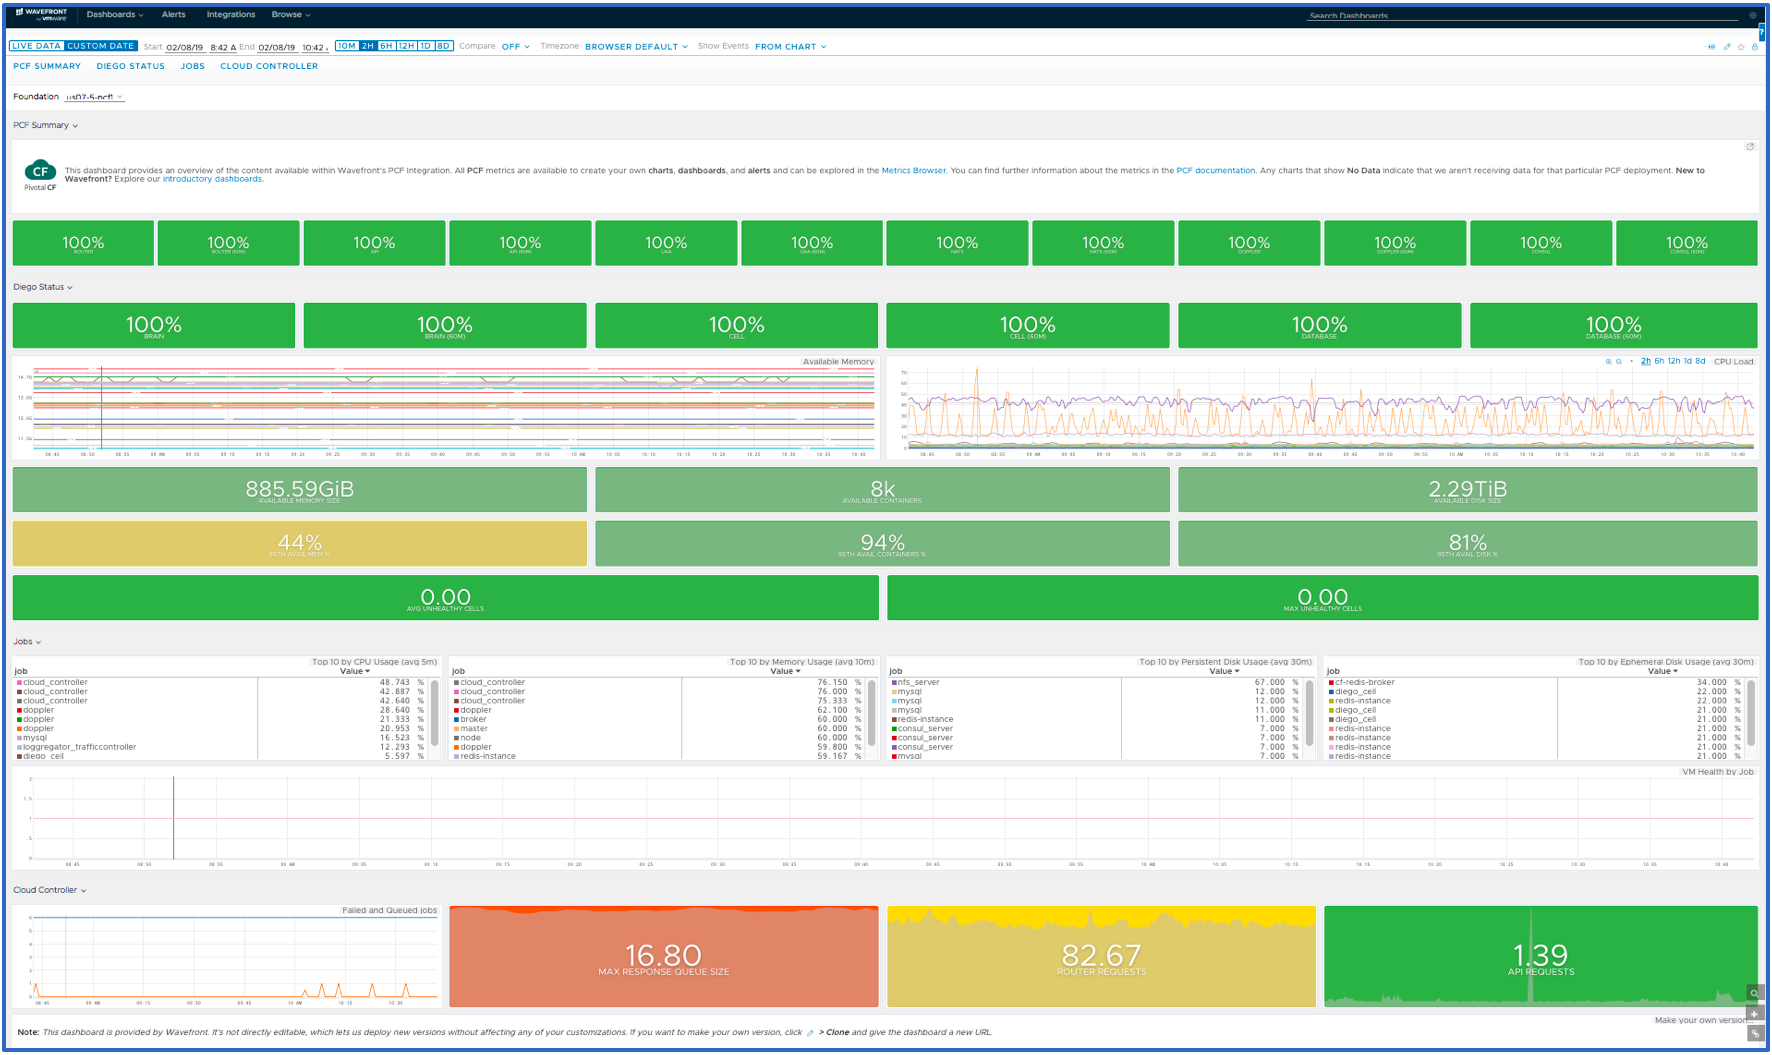
For example, one of VMware’s IT Ops teams runs several PCF foundations with around 8,000 containers per foundation on vSphere infrastructure. They immediately reaped the benefits of the Wavefront PAS/PCF integration. Before using Wavefront, the Ops team couldn’t visualize data from different foundations in a single view. Now daily, they use the Wavefront PAS on PCF Summary dashboard for overall health counts, and the Diego Cell dashboard for views in the CPU, memory usage tuning, effective tasks, and LRPs management alerting (see Figure 3). Through the Wavefront PAS/PCF integration, they have full visibility into their Spring Boot based microservices using Redis, RabitMQ, and MySQL. Finally, they take advantage of Wavefront distributed tracing tooling that enables deep troubleshooting of message spans for fast incident resolution.
 Figure 3. Wavefront PCF Summary Dashboard for a VMware IT Ops Team
Use Case – Developer Visibility
The Wavefront PAS/PCF integration enables developers to collect custom metrics and traces from their applications running on the PCF. Developers can visualize data from applications, cluster components, and cloud services in a single view. They can create fine-grained alerts and use historical data to discover trends and create effective capacity plans. As well, with deep full-stack insight into their applications, developers can quickly investigate and troubleshoot problems.
Here’s how a VMware core development team proactively supports thousands of VMware customers that run their apps on PCF. Eight months ago, before using Wavefront, SLAs were monitored manually, and reports were created bi-weekly. Developers, to understand application behavior and to optimize services, started using metrics and distributed tracing. PAS on PCF metrics are not instance oriented, and they do not provide heap/stack/direct memory segmentation. Also, there is no PAS JVM specific metrics because PAS on PCF is container-based, with no JVM access.
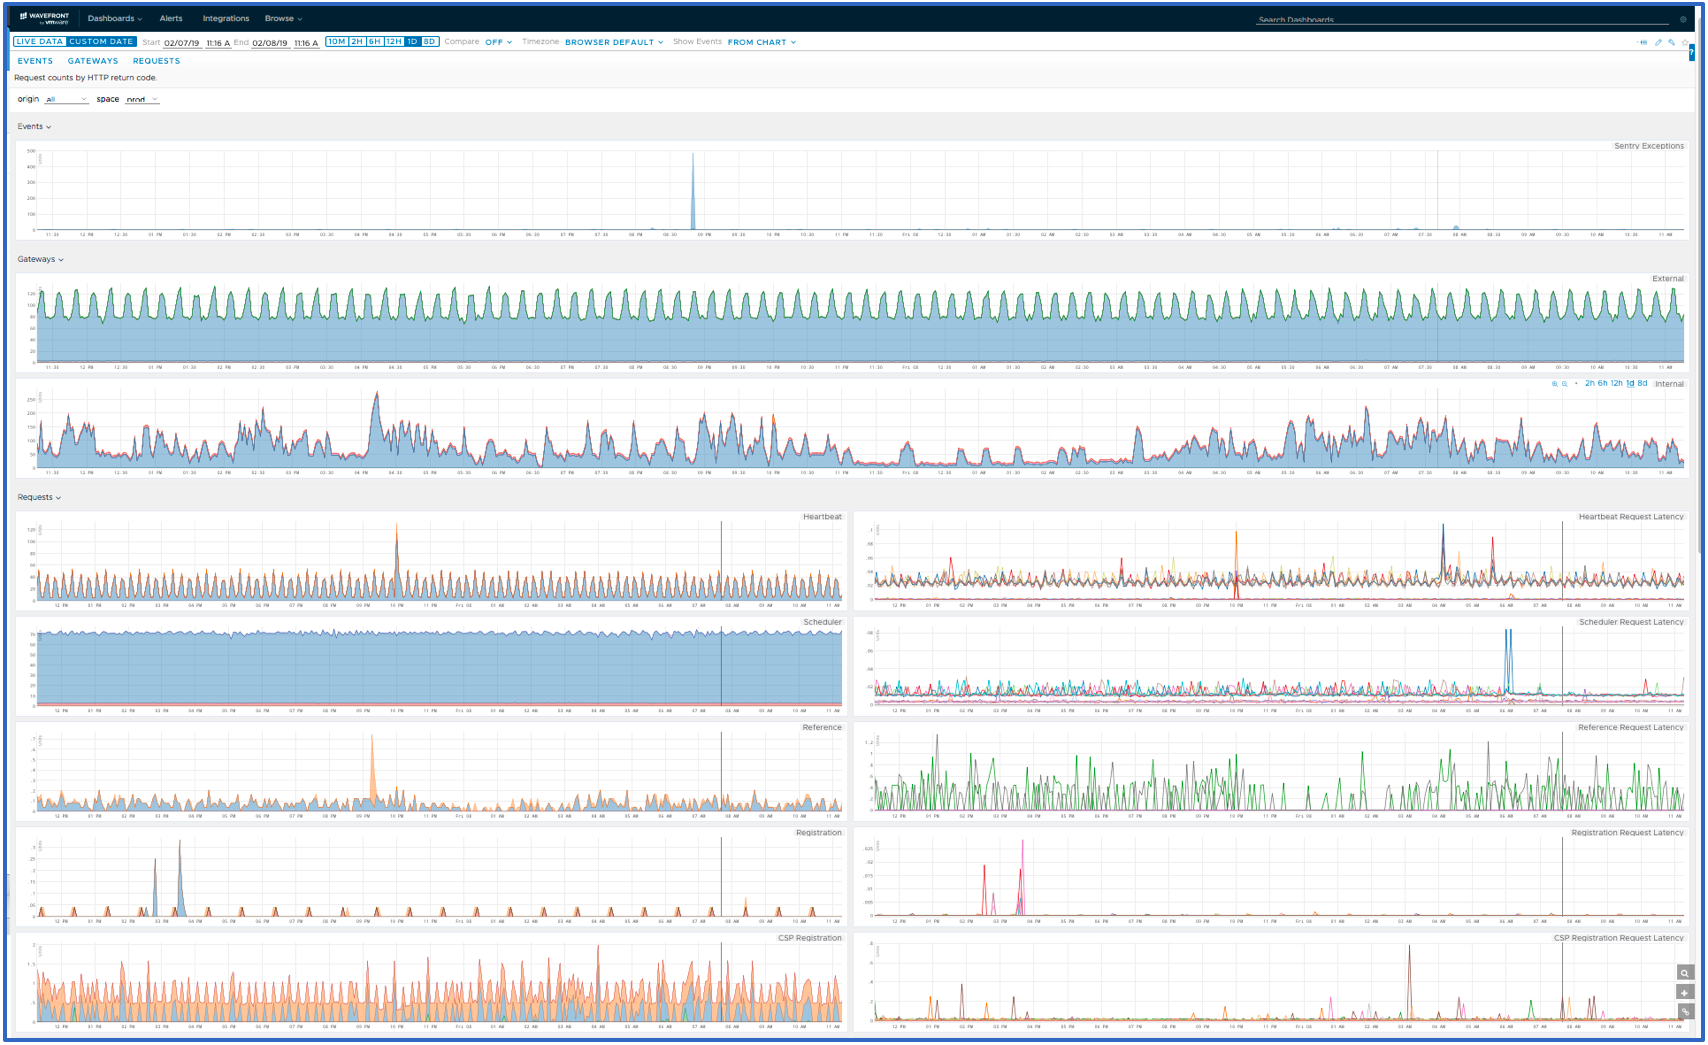
Developers have therefore instrumented their code with Micrometer.io, and they sent application custom metrics to Wavefront for visualization, analysis, alerting and drill-down troubleshooting on SLAs. These tools help developers monitor the production environment and fix isolated issues before service degradation. Wavefront’s real-time, high-granular KPI dashboards (See Figure 4) enables these developers to get back to delivering high-quality code and to speed up daily reporting.
A few developer KPIs of interest from the general SLA dashboard are:
- Cache synchronization latency per source
- Count of unhealthy endpoints – indicating ingestion health
- Request latency and count per status code, service and data center – indicating how busy pipeline is
 Figure 4. Wavefront Dashboard of Internal Team Platform Service
Above all, the VMware internal team’s service monitoring is heavily metrics oriented, and each new service comes with a set of metrics.
Conclusion
Many DevOps and developer teams use PAS on PCF application deployment with a lot of options to quickly spin up services and applications. They enjoy the ability to rapidly develop and iterate on a microservices-based architecture without having to worry about the burden of dealing with scaling infrastructure. They use Wavefront to ingest all their service metrics, setting up an SLA dashboard to monitor operation against SLAs, and then an API Gateways dashboard to monitor incoming call performance. Furthermore, they use Wavefront to set actionable alerts and pinpoint issues earlier across all their services, correlating potential issues between infrastructure and application metrics. They can then drill down into error rates, latencies or throughputs.
If you’re not yet a Wavefront customer, start with our free trial to see how we can help you optimize your PAS on PCF environment.
Get Started with Wavefront Follow @nesgor Follow @WavefrontHQ
The post Pivotal Application Service on PCF Monitoring with Wavefront appeared first on Wavefront by VMware.


