

It’s been exhilarating to witness the evolution of networking over the years – from traditional architectures with classic routers and switches, to Software Defined Networking and adding upon it with cloud networking environments. It’s been just as fascinating to see the transformation of tools used to troubleshoot networking. With the adoption of infrastructure as code for networking components, engineering teams are beginning to add new tooling to see beyond traditional networking. Because these new types of tools are optimized for cloud-native scale, these next-gen monitoring platforms can be easily applied into cloud networking domains. With this shift, troubleshooting cloud networking infrastructure is unified with troubleshooting of cloud applications running with microservices and containers. In this blog, I’ll cover how the VMware NSX-T test team adopted these new methods for troubleshooting and scaling NSX-T Data Center environments, methods that once were the sole providence of the most leading-edge DevOps, SRE and developer teams.
NSX-T Data Center (a.k.a NSX-T) is an agile software-defined infrastructure to build cloud-native application environments. It’s focused on emerging application frameworks and architectures that have various technology stacks including containers environments. NSX-T Data Center works with vSphere, KVM, OpenStack, Kubernetes and Docker.
VMware’s NSX-T Scale Test Team needed a monitoring platform that both testers and developers could use to help them improve the quality of their releases and efficiently resolve not only code issues but with scaling their environments. In particular, they lacked visibility to help them identify outliers and correlate large amounts of data across many sources. A typical test environment for them is: NSX-T Data Center running a thousand hypervisors and 8-10 1000 virtual machines with 20,000 virtual interfaces.
Without a monitoring tool to scale to handle the vast amount of data resulting from the aforementioned environment, it was hard for teams to find problems and resolve development and test issues. This is what lead them to find Wavefront and quickly realized they now had a solution that caters to both their developers and QA teams’ needs
Enter Wavefront
The NSX Scale Test Team first decided to take advantage of Wavefront to find problems which were not easily detected by traditional test techniques. Users of NSX-T Data Center can take advantage of what was done by the NSX Scale Test Team (as described further below) to solve similar problems in large-scale NSX-T deployments. Moreover, there is more for NSX-T customers to gain from using Wavefront. They may need help from VMware support teams to understand their own scaling issues. NSX-T customers can allow remote access of their Wavefront dashboards to VMware support teams who already know how to resolve issues. Some of them are highlighted below.
Troubleshoot Communications Issues Between NSX-T Management Control and Data Plane
The NSX-T architecture, at a high-level, includes the management plane, control plane, and data plane. The management plane is where the user logs in and makes configuration changes. The management plane pushes those changes to the control plane. The control plane decides where the configuration needs to be applied and pushes it to the data plane. Thus, each user action is processed on several levels. That generates a large amount of metrics data to be monitored to ensure successful communication across multiple planes.
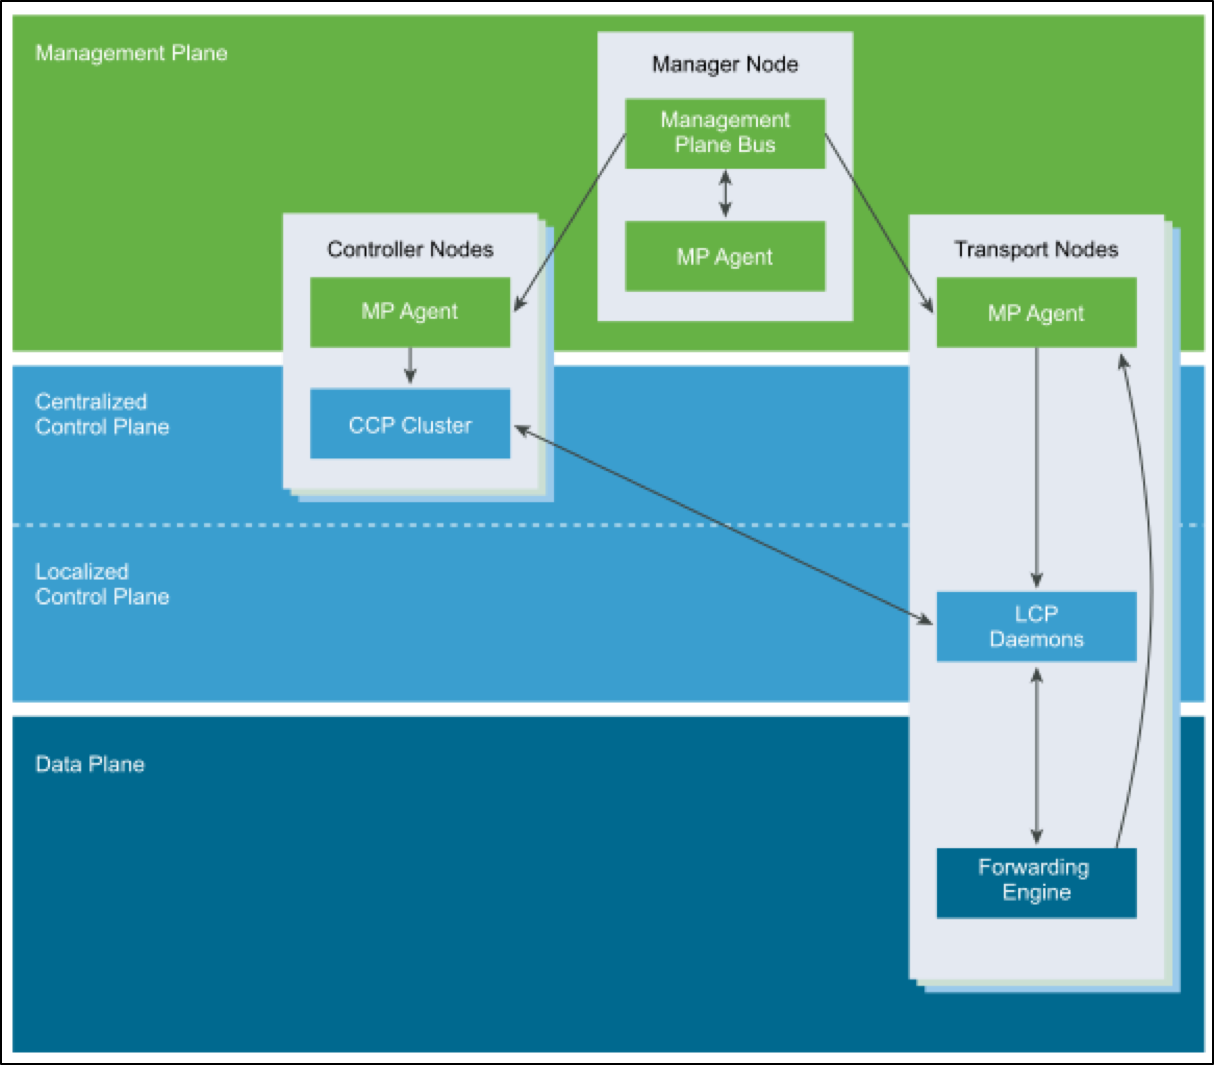
The management plane, the control plane and the data plane all export metrics to Wavefront. Now it’s much easier to correlate all of that data when the problem in communications is detected. The NSX-T team created a dashboard set for each of these planes in Wavefront. When there is a problem in the data plane, they can correlate that data and see how the product was behaving at the control plane and the management plane helping them troubleshoot issues across planes efficiently.
For example, let’s say a specific configuration didn’t get pushed down to Local Control Plane (LCP) and at the same time RPC connections are bouncing. Wavefront can help them to identify the root of the issue and figure out if the cause for bouncing was a config push from Management Plane (MP) to Central Control Plane (CCP). That’s a good data point to understand the problem better. With all performance metrics and configuration events in one place, it is easy to decide where a problem hotspot is.
Troubleshoot Connection Resets
Another use case for the NSX-T Scale Test Team was troubleshooting connection resets. The Wavefront platform can show them how many connections resets happened over a period. And if they drill further, Wavefront could explain the reasons for connection resets. In addition, the test team created a Wavefront dashboard for RPC calls. The RPC count is available, too. It shows them the number of connections that the Central Control Plane (CCP) makes to the Local Control Plane (LCP).
They can follow the data coming from the components of the CCP. Then they can look at the specific action which resulted in unexpected behavior. It tells them which particular element failed. Moreover, identifying failures in a scaled environment is precisely where Wavefront shines, providing visibility to teams across a vast amount of data.
Troubleshoot Increased Memory Usage Across Development and Test Teams
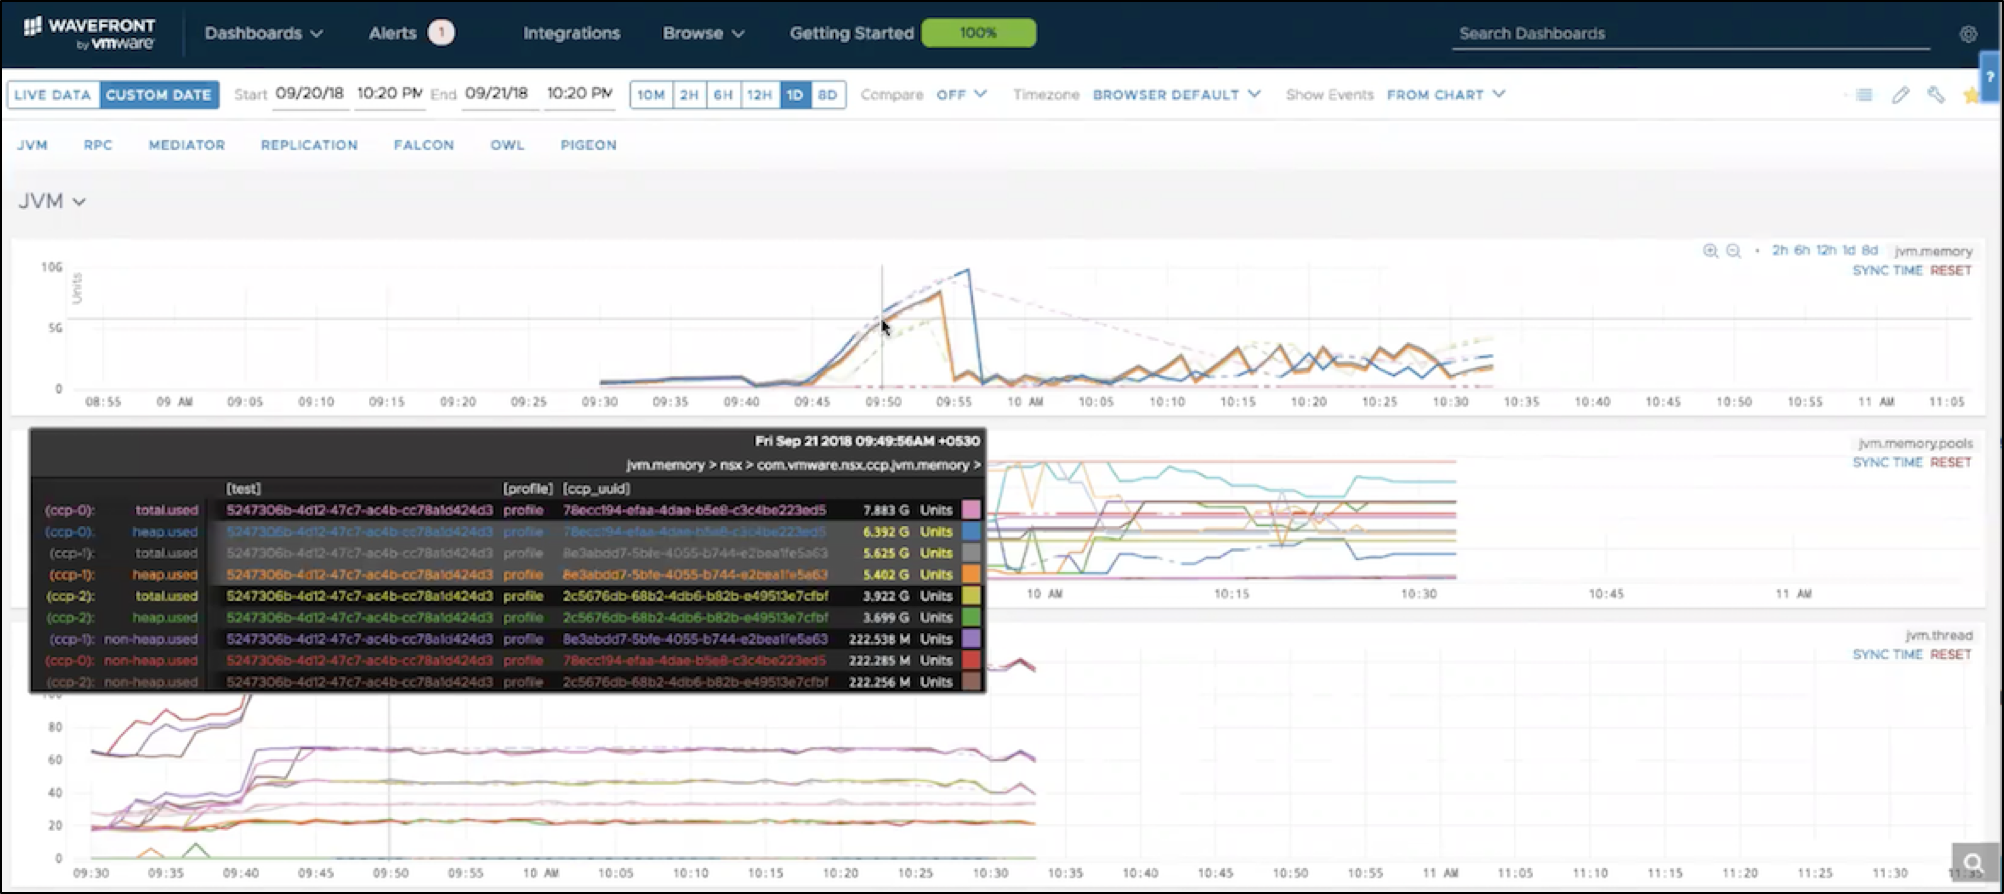
Another category of problems where Wavefront helped NSX engineers is isolating why memory usage across many NSX-T elements was spiking. Correlating memory growth over a large number of metrics sources over time helps teams troubleshoot critical issues in a scaled environment. If the memory usage is high, they can use Wavefront to zoom into the granular and historical data during the memory spike. For example, they can look at JVM memory stats across all controller nodes and executing test runs. Within the Controller Node CCP, they review multiple test-runs, and when they see an increased memory usage, they can file a bug to flag a potential issue in the code that developers can immediately take care of. This unified view helps teams not only troubleshoot faster but also optimize their code for better resource utilization.
Identify Rare Anomalies in a Scaled Environment
Also, Wavefront makes it easy to search for anomalies in metrics over extended periods of time. Then a user can decide if those sporadic anomalies need to be addressed to avoid buildup of unexpected behaviors in the scaled environment. Wavefront retains per second granular data for 18 months.
Deploy NSX-T Upgrades with Confidence, Validated with Analytics Insights
Upgrading NSX-T software is also an excellent example of how Wavefront can help not only test teams but also NSX-T customers too. Once the new NSX-T version is running, the same dashboards are available for users to look for abnormal behaviors that are new.
Summary
Armed with Wavefront, the NSX Scale team is reassured that NSX-T scaling is much less complicated when critical metrics and debug data are available in Wavefront dashboards for developer and QA teams. These real-time and per second insights help them minimize bug buildup and improve the quality of their code, ultimately accelerating development.
The previous examples identified a range of issues that Wavefront addresses successfully, from configuration problems to individual component communication issues to quality issues during the development process. The powerful analytics from Wavefront can be used across many different use cases beyond outlined here including monitoring hybrid cloud (AWS, Azure, GCP) to understanding containers and microservices performance. To uncover how Wavefront can help you – try Wavefront for yourself.
Get Started with Wavefront Follow @stela_udo Follow @WavefrontHQThe post It’s Not a Network Problem! New Ways to Troubleshoot and Scale NSX-T Data Center with Wavefront appeared first on Wavefront by VMware.
About the Author
Follow on Twitter Follow on Linkedin More Content by Stela Udovicic


