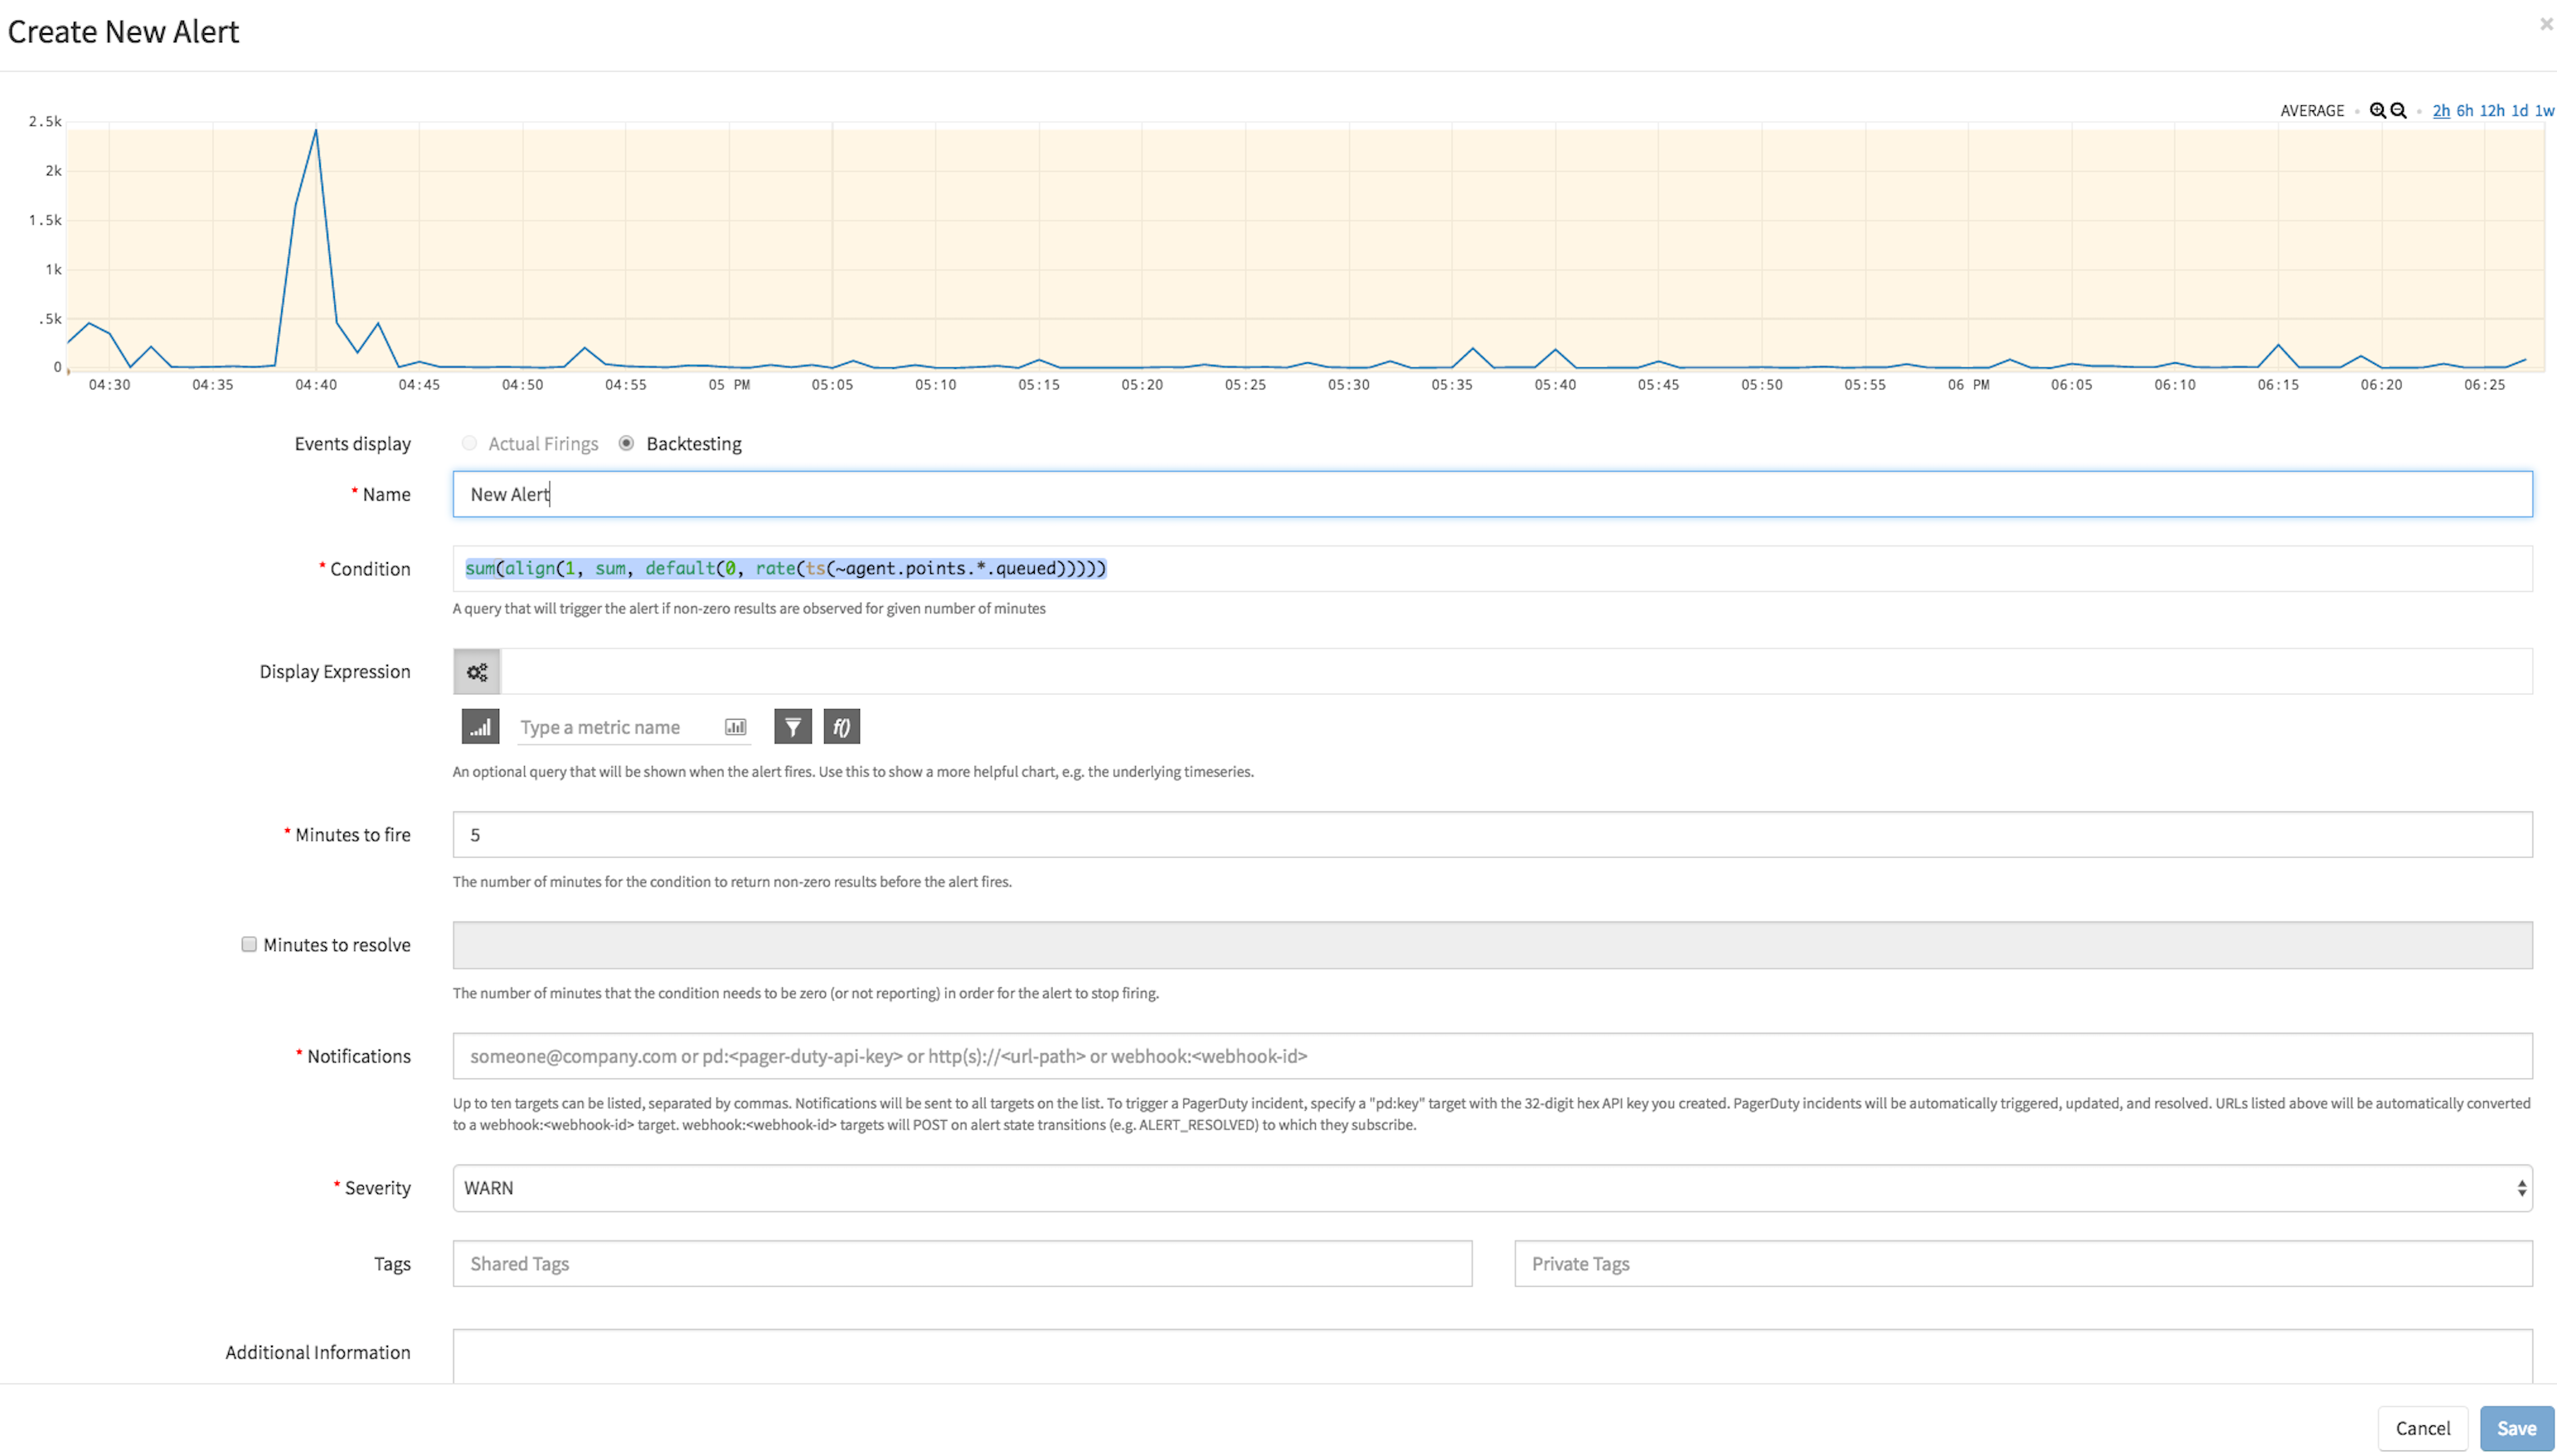
The wider adoption of microservices and containers is leading change in modern application delivery and monitoring approaches. With DevOps, where code in production is continuously updated, and application architecture is highly segmented, a metrics-driven approach coupled with analytics is critical to understanding and maintaining optimal application health. To avoid outages and performance slowdowns, DevOps, SREs and development teams must rely on intelligent alerting. This also means intelligent alerts have to work properly, despite potential metric flow disruptions. You design your cloud applications to be resistant to sub-system failures; critical alerts should have the same design robustness. False positives take their toll, no matter what the underlying cause.
Enter Wavefront! The Wavefront metrics platform offers a powerful yet intuitive way to alert analytically on all your metrics data – from application to infrastructure – no matter the shape, distribution or format. Gathered from our monitoring experience with large SaaS and digital enterprises leaders, here are a few simple tips for making your critical alerts even more robust:
Tip 1 – Alerts that account for delayed metrics
Network delays or slow processing of application metric data at the backend can have a negative impact on alert processing, which can lead to false triggers. An alerting mechanism that is too sensitive to delayed metric data can falsely trigger an alert. As the delayed metric data points are processed, the backfill data will arrive, and the alerts will resolve. The “backfill data” concept means adding missing past data to make a chart complete with no voids and to keep all formulas working. Adjusting the alerting query to account for delayed metric data points will prevent false positives. Use the lag function to avoid this situation:
The above example analyzes the last 30 minutes of the “aws.elb.requestcount” metric. It then compares it with the value measured one week ago and determines if the request count had dropped below 30%. With this alert query, we have not only insured that delayed metric data points do not falsely trigger the alert as we are looking at a wider 30-minute window which allows delayed data points to catch up but also looks at the overall trend of the data.
As an alternative approach, it’s possible to set the “minutes-to-fire” threshold higher than the default two minutes. This setting depends on the frequency of the arrival of data points, and it accounts for all possible delays in the application metrics delivery pipeline. This compensates for external delays of metrics to the Wavefront Collector service.

Tip 2 – Alerts that account for missing metric data points
Sometimes, your host or application can stop sending metrics. Use the `mcount()` function to compensate for that situation. It will count the number of reported points per time series in the last ‘X’ minutes. A general query could be:
Depending on the particular implementation and use case, see the following recommendations:
- The interval associated with `mcount()`should be unique to your set of data. If data is expected to be reported once a minute, then `mcount(30s,)` may not be the best approach. Also using `mcount(1m)` can result in false positives due to delays. Selecting, `mcount(5m,)` is a better choice as it requires 5 minutes of “NO DATA” to trigger.
- The `= 0` clause in the prior example query can also be tweaked. If you want to know when there has been “NO DATA” being reported, then it’s the right approach. However, if you expect data to be reported once a minute, and you’d like to know when it’s not consistently getting reported, then mcount(5m, ts(my.metric)) <= 3 would work better. With this approach, the alert is triggered with only two missing data points in the 5-minute window.
Tip 3 – Alerts that check metric data flows from Wavefront Proxy
The Wavefront Proxy is software that allows you to collect application and infrastructure metrics using your open-source agent of choice like collectd, statsd, telegraf and others. After data collection, the Wavefront Proxy then pushes the data to the hosted Wavefront Collector service. It’s essential to confirm that the Proxy is checking-in with the Collector service to ensure that metrics data are actually being pushed to the cloud. To create this alert, use the following Wavefront time-series query:
This query uses the ~agent.check-in metric to verify if the Wavefront Proxy is reporting-in. If they don’t report, it uses the default function to provide a default value of -1. So it triggers an alert when that value equals -1.
To learn more about Wavefront’s query-driven smart alerting on metrics refer to our documentation. Try the Wavefront platform today for free!
Follow @WavefrontHQ Follow @stela_udo Follow @paragsf
The post Intelligent Alert Design: Three Simple Tips for Increasing Alert Robustness appeared first on Wavefront by VMware.


