

External linking helps engineering teams connect Wavefront to logging tools such as vRealize Log Insight, ELK, or Splunk. For example, when you have received alerts and see them in Wavefront, and then want to investigate them further by drilling down into logs, you can quickly do that using the Wavefront External Links feature.
In this blog, I’ll explain how the Wavefront External Links functionality works and show you a use case where external links are essential in a troubleshooting scenario. The Wavefront External Links feature lets the Wavefront UI pass information that exists in the Wavefront metrics (such as source, period, tags, etc.) to external applications. Wavefront transfers data only to applications that can be invoked via URL. Wavefront metrics info is part of the URL, and an external application can use that information to provide additional details important for troubleshooting your cloud application. Check out the Wavefront documentation to get more information about external linking.
Practical Example: Using External Links to Connect to vRealize Log Insight
Let me show you how to create an external link that can help you open all the logs available in vRealize Log Insight that come from a particular ESXi host.
Log in to your Wavefront instance and select Browse > External Links:
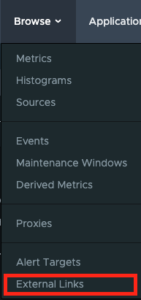
Select External Link
In the Edit External Link dialog box, enter the information to connect to vRealize Log Insight:
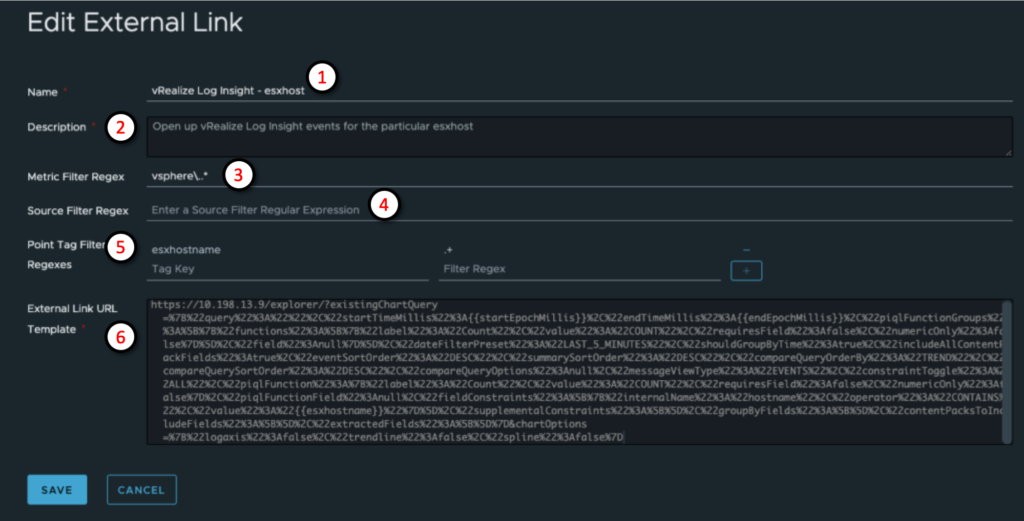
Edit External Link
- Choose a meaningful name of the external link. The name is important later when you trigger the external tool you are linking to.
- Provide a description of the external link.
- Select the metrics you want to show:
- * If you leave the Metric Filter Regex empty, the external link shows all metrics.
- * You can filter the metrics by setting the regular expression. For example, in the screenshot above, we select metrics starting with vSphere.* which is the prefix for all VMware related metrics.
- (Optional) If you want to limit the external link further, use the Source Filter Regex to limit the external link to a set of selected sources.
- (Optional) Use the Point Tag Filter Regex to limit external link metrics to a set of specific tags and values. In the example above, the point tag key was set to esxhostname.
- Specify the External Link URL. The external URL includes a normal URL with Mustache syntax embedded in it.
For this example, I created that URL by copying it from the vRealize Log Insight analytics page. The URL executes a query to retrieve and display logs. The parts of the URL which contain the information provided by Wavefront are highlighted in red below:
https://10.198.13.9/explorer/?existingChartQuery=%7B%22query%22%3A%22%22%2C%22startTimeMillis%22%3A{{startEpochMillis}}%2C
%22endTimeMillis%22%3A{{endEpochMillis}}%2C%22piqlFunctionGroups%22%3A%5B%7B%22functions%22%3A%5B%7B%22label%22%3A%22Count
%22%2C%22value%22%3A%22COUNT%22%2C%22requiresField%22%3Afalse%2C%22numericOnly%22%3Afalse%7D%5D%2C%22field%22%3Anull%7D%5D
%2C%22dateFilterPreset%22%3A%22LAST_5_MINUTES%22%2C%22shouldGroupByTime%22%3Atrue%2C%22includeAllContentPackFields%22%3Atr
ue%2C%22eventSortOrder%22%3A%22DESC%22%2C%22summarySortOrder%22%3A%22DESC%22%2C%22compareQueryOrderBy%22%3A%22TREND%22%2C%
22compareQuerySortOrder%22%3A%22DESC%22%2C%22compareQueryOptions%22%3Anull%2C%22messageViewType%22%3A%22EVENTS%22%2C%22con
straintToggle%22%3A%22ALL%22%2C%22piqlFunction%22%3A%7B%22label%22%3A%22Count%22%2C%22value%22%3A%22COUNT%22%2C%22requires
Field%22%3Afalse%2C%22numericOnly%22%3Afalse%7D%2C%22piqlFunctionField%22%3Anull%2C%22fieldConstraints%22%3A%5B%7B%22inter
nalName%22%3A%22hostname%22%2C%22operator%22%3A%22CONTAINS%22%2C%22value%22%3A%22{{esxhostname}}%22%7D%5D%2C%22supplementa
lConstraints%22%3A%5B%5D%2C%22groupByFields%22%3A%5B%5D%2C%22contentPacksToIncludeFields%22%3A%5B%5D%2C%22extractedFields%
22%3A%5B%5D%7D&chartOptions=%7B%22logaxis%22%3Afalse%2C%22trendline%22%3Afalse%2C%22spline%22%3Afalse%7D
For better visibility, see the following decoded URL, which exposes a JSON payload that defines what I what to see from the logs and when I want to see it.
https://10.198.13.9/explorer/?existingChartQuery={
    "query":"",
    "startTimeMillis":{{startEpochMillis}},
    "endTimeMillis":{{endEpochMillis}},
    "piqlFunctionGroups":[{
        "functions":[{
            "label":"Count",
            "value":"COUNT",
            "requiresField":false,
            "numericOnly":false
        }],
        "field":null
    }],
    "dateFilterPreset":"LAST_5_MINUTES",
    "shouldGroupByTime":true,
    "includeAllContentPackFields":true,
    "eventSortOrder":"DESC",
    "summarySortOrder":"DESC",
    "compareQueryOrderBy":"TREND",
    "compareQuerySortOrder":"DESC",
    "compareQueryOptions":null,
    "messageViewType":"EVENTS",
    "constraintToggle":"ALL",
    "piqlFunction":{
        "label":"Count",
        "value":"COUNT",
        "requiresField":false,
        "numericOnly":false
    },
    "piqlFunctionField":null,
    "fieldConstraints":[{
        "internalName":"hostname",
        "operator":"CONTAINS",
        "value":"{{esxhostname}}
    "}],
    "supplementalConstraints":[],
    "groupByFields":[],
    "contentPacksToIncludeFields":[],
    "extractedFields":[]
}
&chartOptions={"logaxis":false,"trendline":false,"spline":false}
The startEpochMillis, endEpochMillis, and esxhostname are either reserved variables that the Wavefront link uses (start and end epoch milliseconds), or properties that Wavefront discovers within the metric data (esxhostname). Wavefront replaces these variables in the link template and opens the vRealize Log Insight web page.
After saving data from the External Links window, we can test it out:
- In the Wavefront UI, select Integrations, find the vSphere integration and select the ESXi Host Summary dashboard.
- Select a desired host from the ESXi Host Summary.
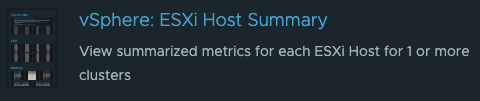
vSphere: ESXi Host summary
The host will be highlighted in the dashboard as shown in the screenshot below.
- If you see something of interest (a potential anomaly) in the dashboard, you highlight the host:
- Select the metric (notice the source w3-hs1-050213.eng.vmware.com selected).
- Right-click to bring up the External Links menu, in this example External Links > vRealize Log Insight – esxhost.
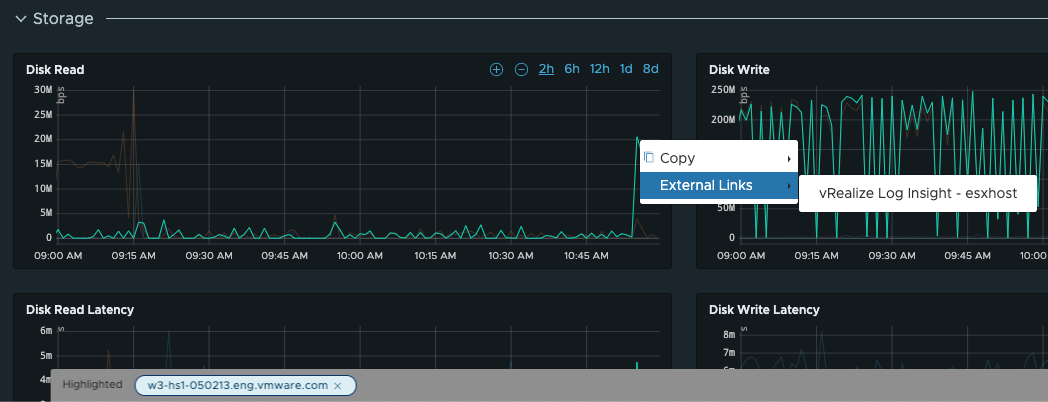
- Select External Links. the vRealize Log Insight opens. It contains logs from the selected ESXi host. The following screenshot illustrates this. Navigating to the particular host was possible because the URL included data passed from Wavefront about that host.
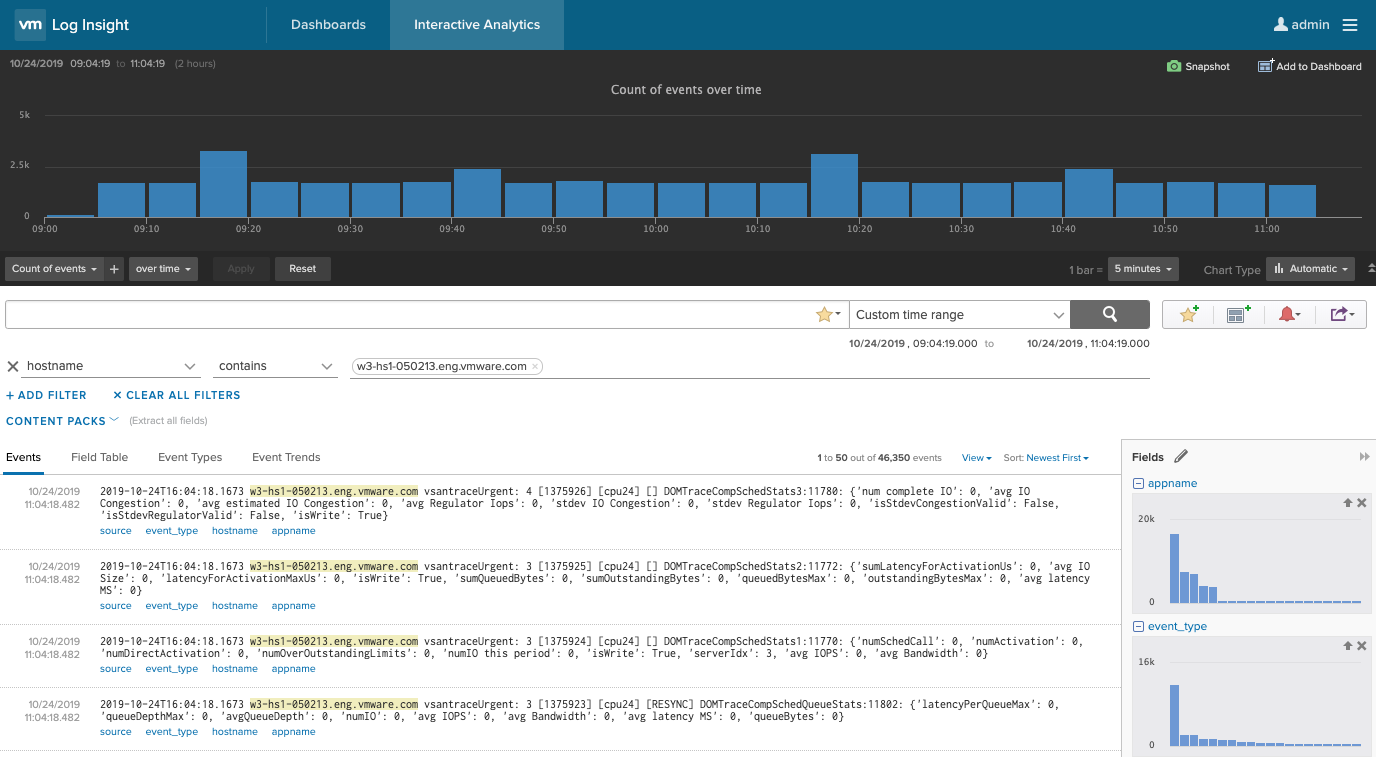
Log Insight Data
Summmary
In summary, in the previous example, I showed you how to access logs by connecting the Wavefront platform to vRealize Log Insight using the Wavefront External Links feature. You can use Wavefront External Links for much more because they are generic. For example, you can point to URL-accessible reports, Microsoft Teams documents, or other Wavefront charts. As a result, you have much more information at your fingertips about incidents you observe with the Wavefront platform. This helps you reduce context switching and MTTR. Want to take External Links for a spin? Sign up for a Wavefront free trial!
Get Started with Wavefront Follow @YooHoward Follow @WavefrontHQThe post How to Connect Wavefront Observability with Logging Tools Using External Links appeared first on Wavefront by VMware.
About the Author
Follow on Twitter More Content by Howard Yoo


