

I recently sat on a panel at the ContainerWorld 2017 conference, discussing the maturity model of containers — and where we were (as an ecosystem) on the spectrum from stable technology, to monitoring, to basic management, to being part of the “invisible background” of technology infrastructure like TCP/IP stacks.
All of the panelists agreed that we had just passed the milestone of stable(-ish) technology, but that monitoring, management, and full maturity were well into our collective future. I went further, giving a reason that tried to explain why we seemed to be in the perpetual spring of this transformative (and very well-invested) technology:
“Containers are leaky abstractions.”
My co-panelists stopped and nodded.
I gave a brief explanation for the audience, but I wanted to elaborate and motivate my comment a bit more deeply. First, I’m going to take a step back, and explain what leaky abstractions are (and where they come from). Then, I’ll give you a concrete example of how to work with leaky abstractions using Wavefront — by the end, you’ll understand why leaky abstractions require dynamic monitoring platforms.
What is a Leaky Abstraction?
First, some context. What is a leaky abstraction? Software systems are built through hierarchical decomposition — no one can track the activity of every logic gate or transistor in the execution of typical software — so we abstract over complex layers with simpler (not necessarily simple) interfaces. We commoditize different systems to look similar, which is how I can write a python script on my laptop and run it on either a production server or on my iPhone.
And as any experienced engineer can tell you, almost all abstractions are leaky. Their ‘leakiness’ falls on a spectrum, from relatively low to surprisingly high (browser compatibility, I’m looking at you!). Outside of mathematical models, no abstraction is perfect. The underlying reality will always assert itself — through performance, selective implementations, side effects, and many other behavioral clues. Joel Spolsky’s “Law of Leaky Abstractions” sums it up well — any non-trivial abstraction is leaky to some degree. I’d clarify that to say that any abstraction which is not merely the identity function is leaky, to some degree. And such an “abstraction” would hardly deserve the name.
What determines how leaky an abstraction is? As with so many of The Big Questions, it comes down to information theory. Think of the underlying system — and the abstraction/interface above that system — as being two linked but separate entities. The first has a complexity (entropy, degrees of freedom, dimensionality) of behavior. The second has a complexity of specification.
The mismatch between those two complexity measures tells you how ultimately leaky the abstraction will be (or provides, at the very least, a lower bound). When the mismatch is wide — encapsulating inherently complicated systems with simple interfaces— the interface can fail to provide the right measure of understanding and control on the underlying system.
For operational systems that we need to manage, this means that we’re forced to understand multiple levels simultaneously — holding one hand on the steering wheel even as we poke around the engine.
This will remind some readers about the trade-offs in compression. You can only compress a given set of data so far without lossiness, based on its entropy (or more accurately, the Kolmogorov complexity). Interfaces compress behavior in the same way, and if you try and stretch the compression ratio too high, you’ll end up with abstraction “lossiness”: some underlying behavior that isn’t accounted for in your interface, and which could (and probably will) come back to bite you.
The Container Challenge
Containers are explicitly an abstraction. That’s why we use the word “container” — because we’re trying to virtualize the underlying operating system across multiple contexts, each of which is (somewhat) contained. The benefits that containers promise regarding agility, dependency management, and continuous delivery are unmistakable.
Anyone who has used Docker for more than a year is painfully aware of the leakiness of the container abstraction — breaking changes between versions, the revolving door of recommended storage drivers, I/O performance in certain configurations (cough loopback cough), garbage collection of old images, etc. As my co-panelists agreed, they were willing to take some pain to get the benefits — they just wanted a better way to handle the monitoring and management side, now.
Proper monitoring matches the problem space. When the problem area includes an array of leaky abstractions, that means being able to provide fast insight at dynamic abstraction layers as well as intermingling different levels of details/description. I’ll give you a simple example using Wavefront.
Uncover Hidden Battles for Resources with Wavefront Unified Metric Analytics
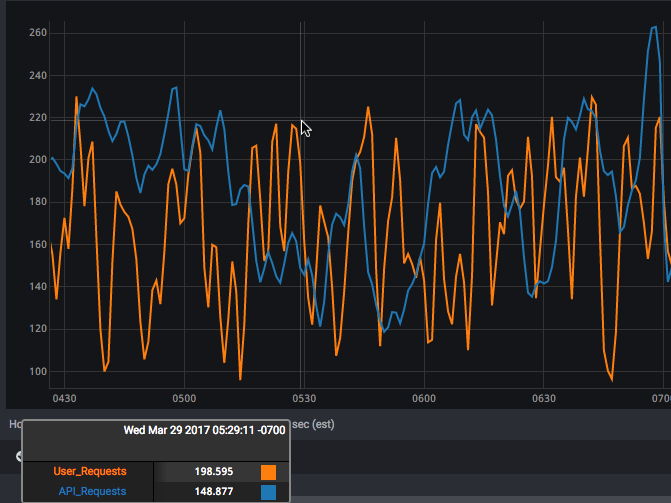
Suppose you’re running two microservices, each isolated to their container, each responsible for processing some pipeline of external requests (perhaps browser vs. API). And suppose those two containers share some set of resources — say, CPU and storage but not network. Here are the request rates for each of the services in “peacetime”:
Note that the two request rates don’t look connected to each other. But then, all of a sudden, at about 07:00, you see the behavior change to this:
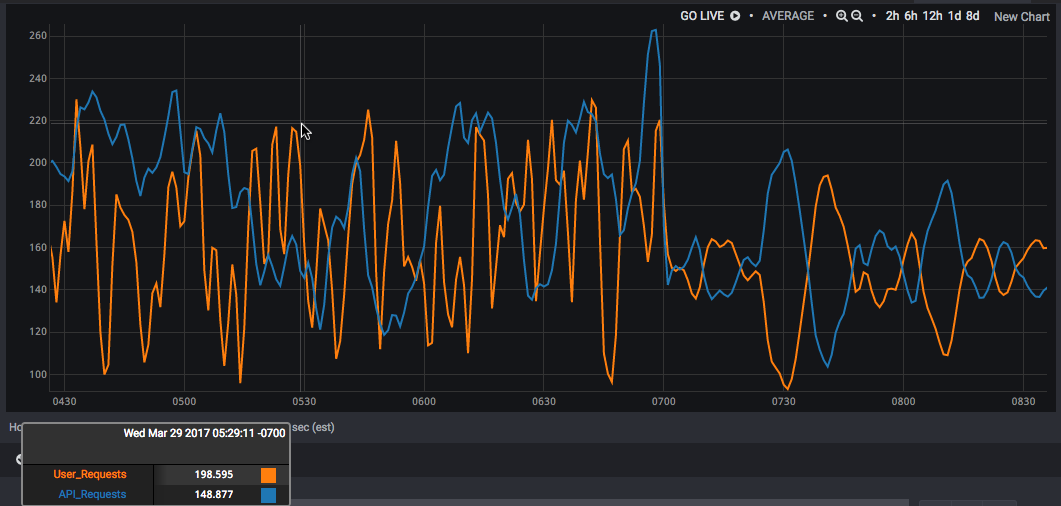
Now, we have an almost perfect inverse correlation between the two metrics. What’s going on?
This pattern is often a tell-tale sign of a shared constraint between the two services. Normally, their rates are driven by uncorrelated external demand. But when some shared resource gets pegged, they’re fighting a zero-sum game over internal supply. And what was uncorrelated becomes, well, correlated. When one service gets more, the other gets less, and neither of them is getting all the capacity they want. (Parents with multiple kids will know exactly what I’m talking about.)
Now, which shared resource is the problem? Is it the CPU or the storage? Let’s pierce the abstraction a little bit and look at those two underlying resources directly:
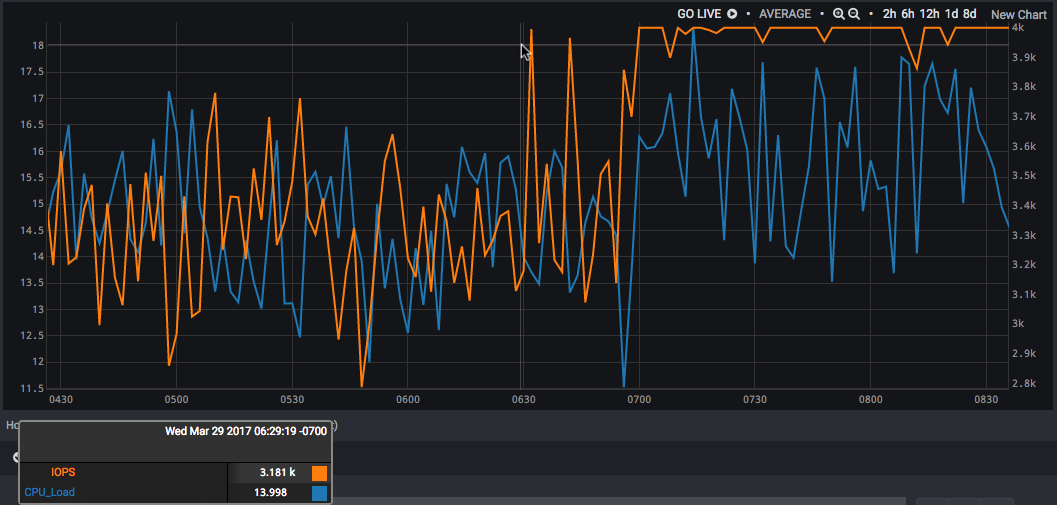
Interesting. The CPU (blue, left axis) is slightly higher than it was, certainly, but it seems to have the same basic shape as during peacetime. Storage IOPS (orange, right axis), however, has hit some ceiling and is spending most of its time near the max. Interpreted as distributions, the CPU distribution has shifted slightly while the IOPS distribution has undergone a very large shift as well as showing massive negative skew.
Using Wavefront Metrics for Aggregated Container and Microservices Monitoring
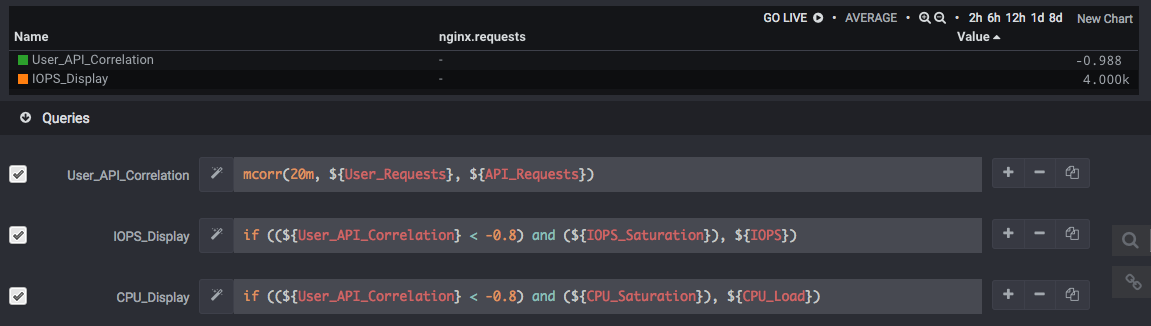
What if we wanted to track all four of these metrics in the same conceptual space? We can actually derive a conditional metric — one which shows up only in certain conditions (here, when the API and browser metrics show a very strong negative correlation, and when either of the resource metrics is showing signs of saturation). In this case, the correlation (green) drops to near -1, and the IOPS line (in orange) starts showing up:
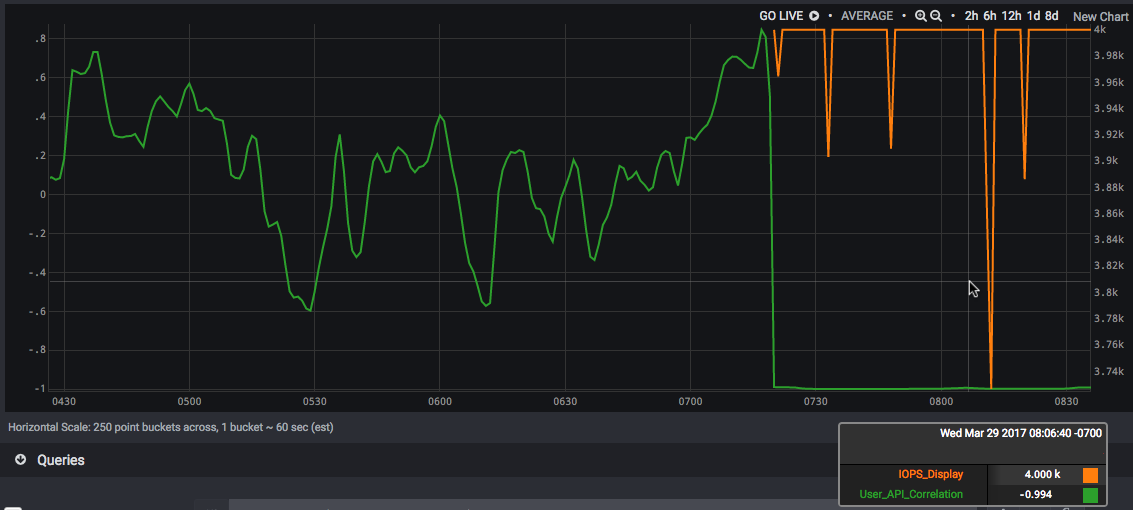
If we put this into a table, we can just read off the symptoms and the most likely cause at a glance. Using Wavefront platform we can see the User/API correlation has dropped to near -1, and the IOPS looks awfully suspicious just below it:
There are two things going on in our example. First, we were able to see different levels of the system in a single context. Second, we’re able to create a new abstraction layer (our conditional metric) instead of just passively tracking the abstraction(s) provided to us. Especially in cloud applications, those existing abstractions just aren’t enough.
We can further iterate that dynamic abstraction layer based on our ability to manage the system to our own KPIs; two teams that use microservices and containers in different ways may have very different perspectives on what matters for their abstraction.
This ability to create dynamic abstractions wasn’t part of the table stakes in monitoring traditional three-tier architectures a generation ago, but it has become so in the modern era. If you want a more hands-on experience with what I’m talking about on your data, try Wavefront.
Attending Dockercon 2017? Stop by Wavefront booth to see our container monitoring and other demos.
Get Started with Wavefront Follow @devnag Follow @WavefrontHQ
The post Containers are Leaky Abstractions (and other truths I hide from my kids) appeared first on Wavefront by VMware.


