

When supporting some of the world’s largest and most successful SaaS companies, we at Wavefront by VMware get to learn from our customers regularly. We see how they structure their operations, how they implement their monitoring and automation policies, and how they use smarter alerts to lower mean time to identify and mean time to automate.
In part 1, I have discussed concepts such as simple vs. smart alerts, anomaly definition, metric-based vs. logs-based anomaly detection, and the value of an expressive language for using analytics to find anomalies specific to your cloud application environment. Here in part 2, I dive into the first five smart alerting examples used by top SaaS companies, starting with the most basic – a range alert.
Smart Alerting Examples
Let’s review the first set of examples of metrics anomalies and how analytics can be used to easily create alerts to quickly detect them. All of these examples have a common, hidden theme – a framework if you will – which I’ll discuss in part 4 (teaser alert!). In each of these examples, I’ll draw a red box around the location of the anomaly on each chart, and you’ll see what the anomaly actually is and how to detect it.
1. Alerting on a Range Anomaly
The first smart alerting example is for the simplest of anomalies, one that crosses a specific threshold range. In Figure 1 below, the blue line goes between three and ten, and then it spikes up beyond 10. The red box highlights the anomaly.
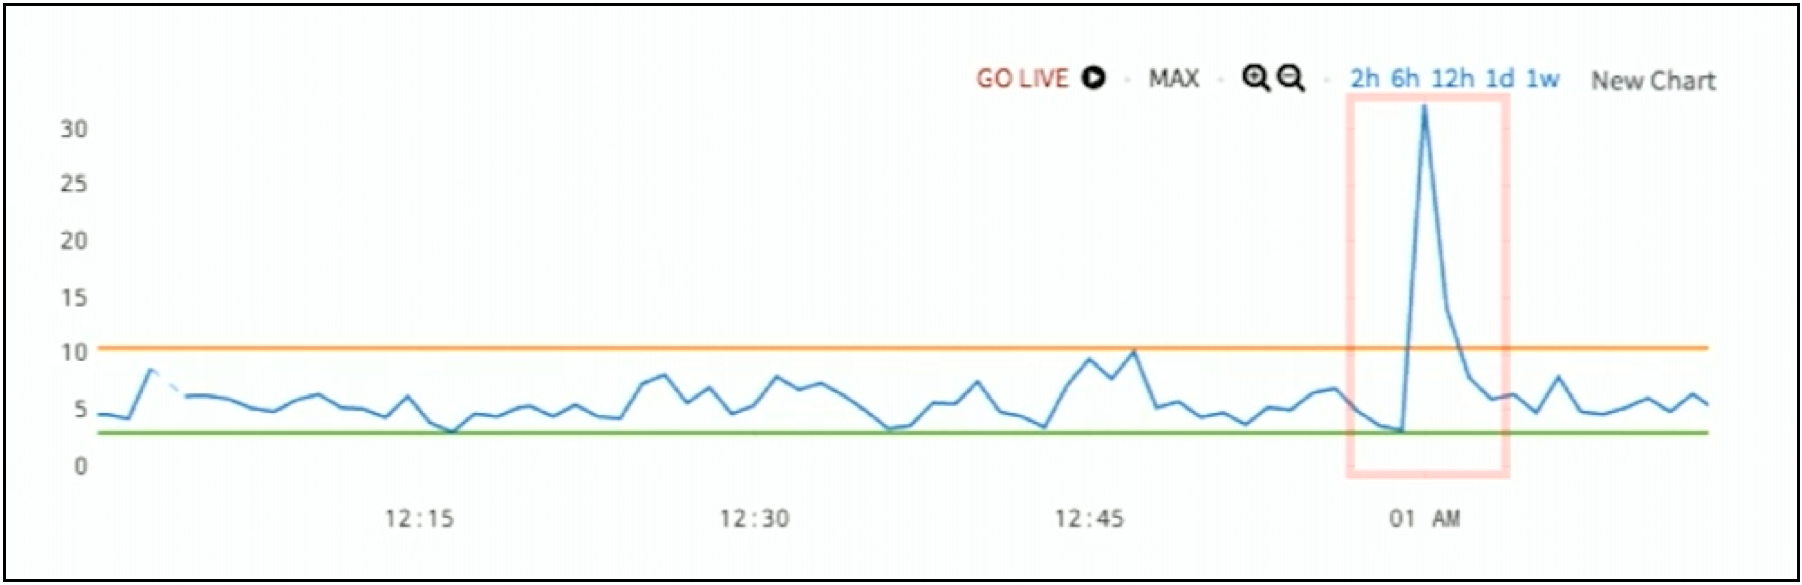 Figure 1: Example of Threshold Range Alerting
In this example, the anomaly is pretty obvious. This threshold range is the baseline. Unfortunately, most cloud application anomalies aren’t so simple to be detected this way.
2. Alerting on a Windowed-Deviation Anomaly
How about data in Figure 2 below? The red box has some anomaly. What the anomaly is, doesn’t quite jump out at you.
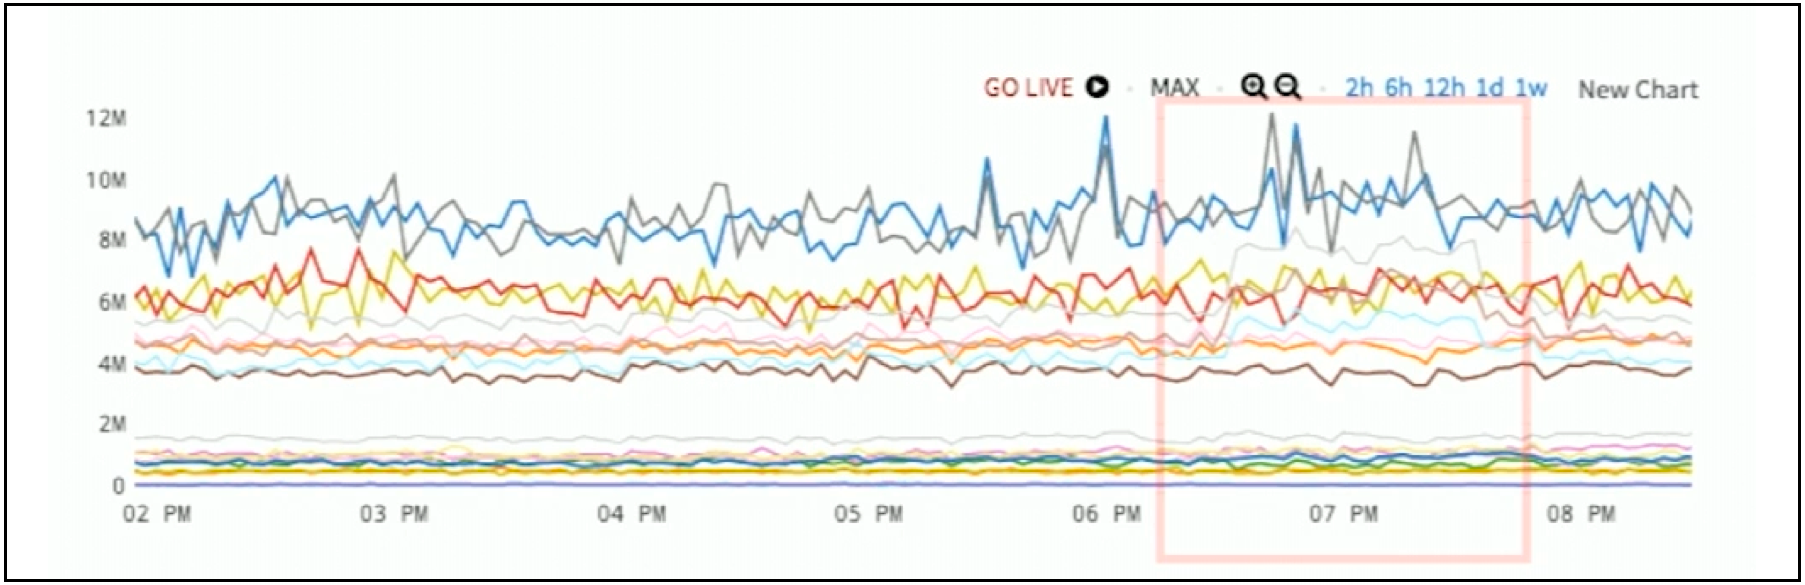 Figure 2. Data Sample for Window-Deviation Alerting
If I actually highlight one of these lines as in Figure 3, you can see that one of these lines has a baseline that’s pretty static and stable. At approximately 6:10 PM, it jumps up for an hour and a half and then it comes back down. That’s the anomaly.
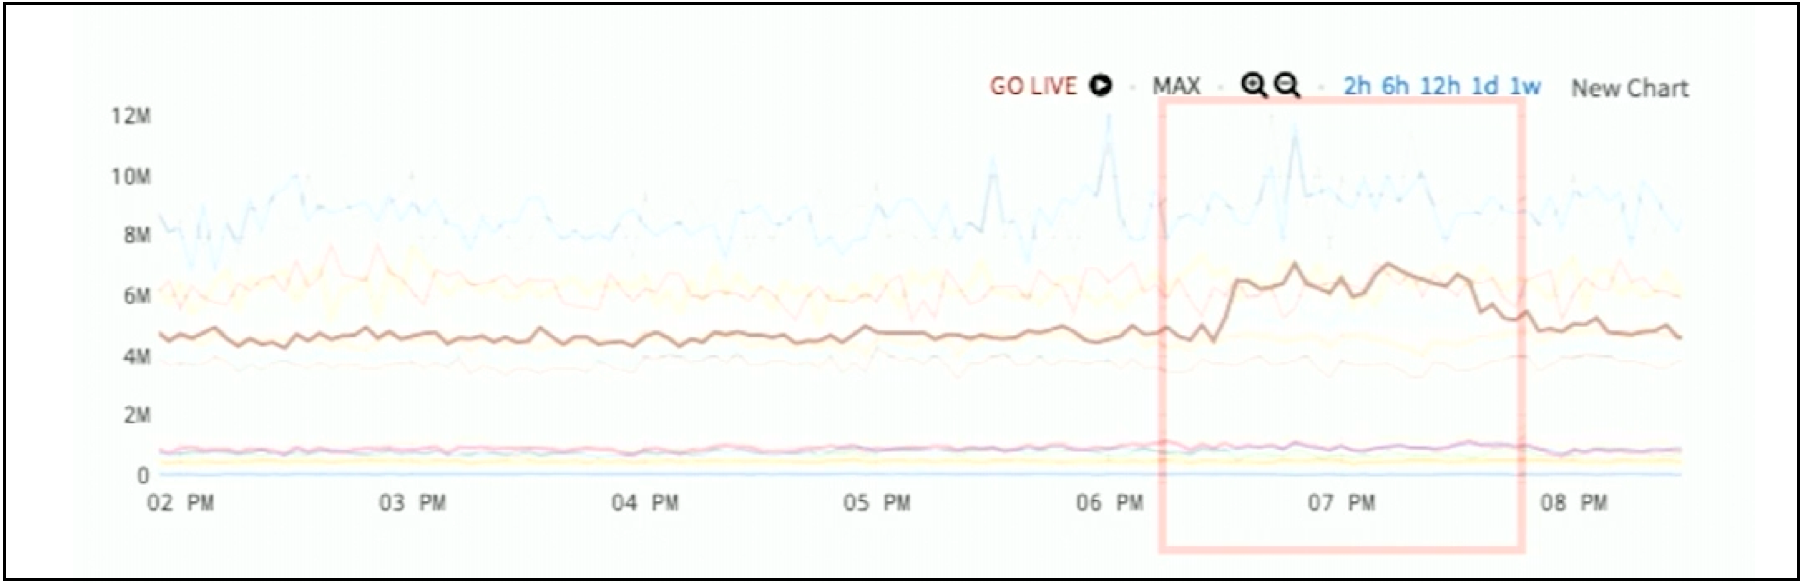 Figure 3. Highlighted Anomaly for Window-Deviation Alerting
In the chart in Figure 2, you can’t really see the anomaly. It’s hidden within tens or hundreds or even thousands of other lines. It disappears into the noise. However, there are lots of ways to fix that. One common approach is to take a standard deviation or use the interquartile range – we have a whole bunch of techniques to say how unusual each new point of each series is compared to its own recent history.
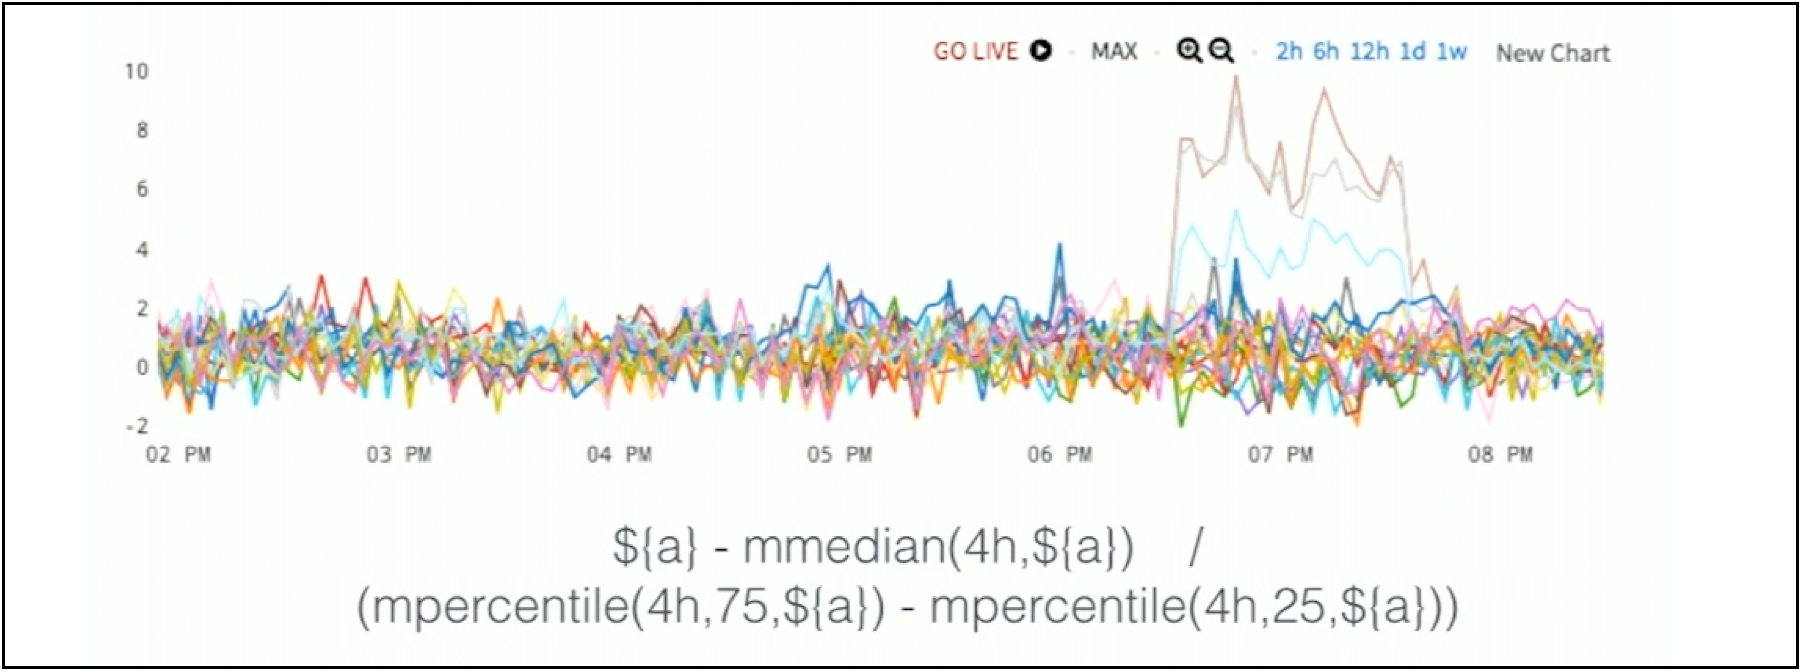 Figure 4. Using Interquartile Range to Detect Anomaly
If the metric typically stays in a particular range of values and it jumps way above or way below that, Wavefront can show that to you. Now, you can see in Figure 4 that the outliers stick out quite easily. There are three of them and they’re very obvious to see. You can see exactly when they start and when they end. Everything else has been scaled down to zero. So here, normal has been defined as a small window deviation.
3. Alerting on a Seasonal Ratio Anomaly
How about here? In Figure 5 is a very volatile chart shown across two and a half weeks. It goes up and down. So why is that one crevasse the anomaly, and why not something else?
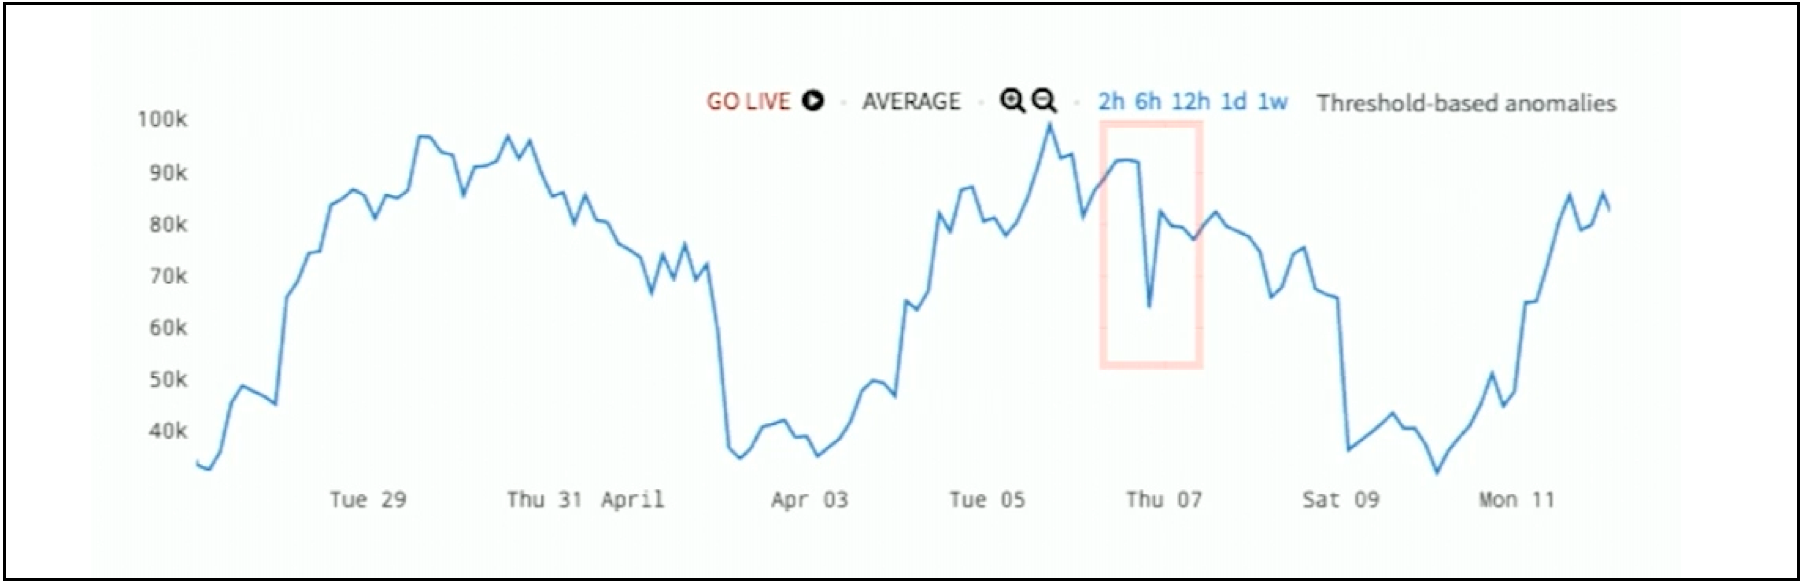 Figure 5. Hidden Seasonal Anomaly
Even though this looks very jagged and random, if you take a seasonal ratio by dividing each point by the point exactly one week earlier, you see in Figure 6 that the ratio is always between 1 and 1.1. It’s always very stable.
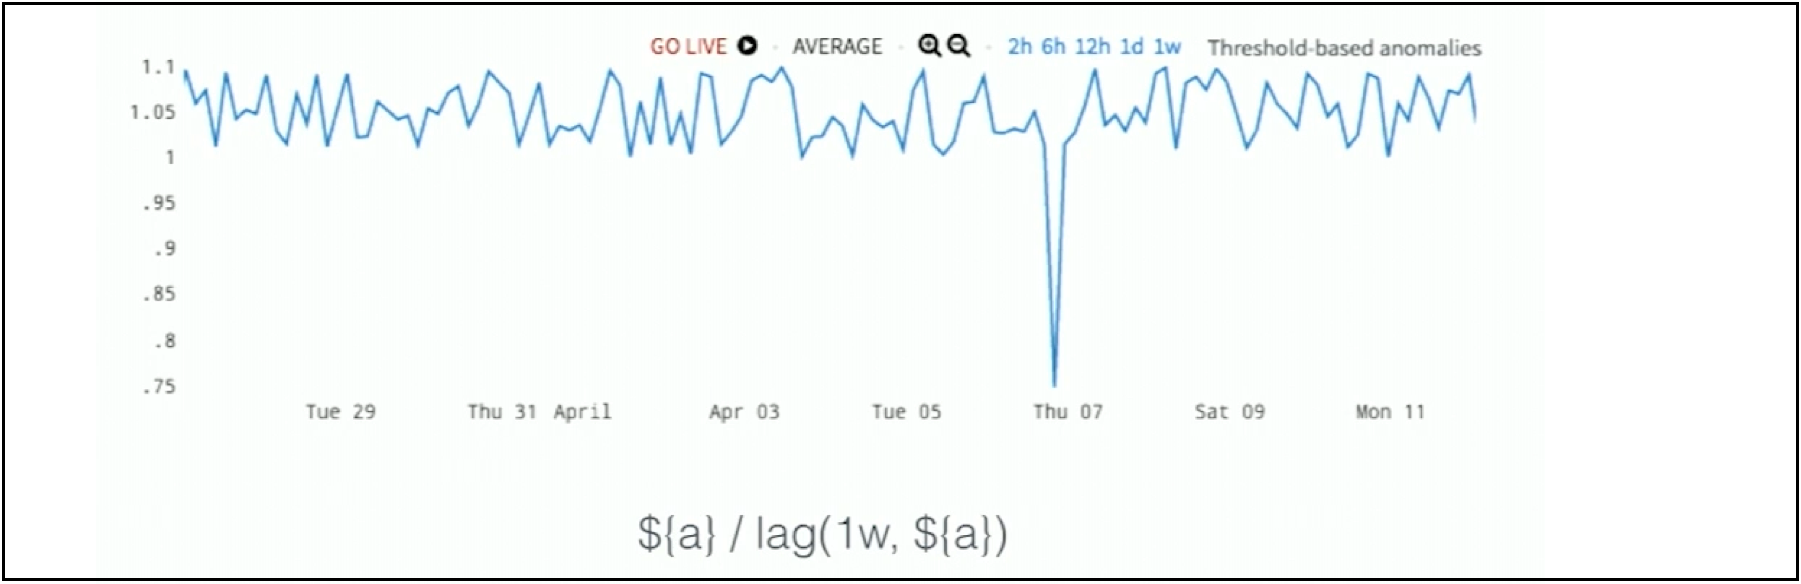 Figure 6. Capturing Hidden Seasonal Anomaly with Ratio Alerting
But, there is one dip down to 0.75, and that’s the anomaly. Again, it’s very hard to see this anomaly in our first chart because it just doesn’t stick out as it does in the second chart. In short, analytics are needed to bring the anomaly out into the forefront.
4. Alerting on a Constant Rate Anomaly
What’s the anomaly here in Figure 7? You see two parallel lines, and there’s no structure whatsoever.
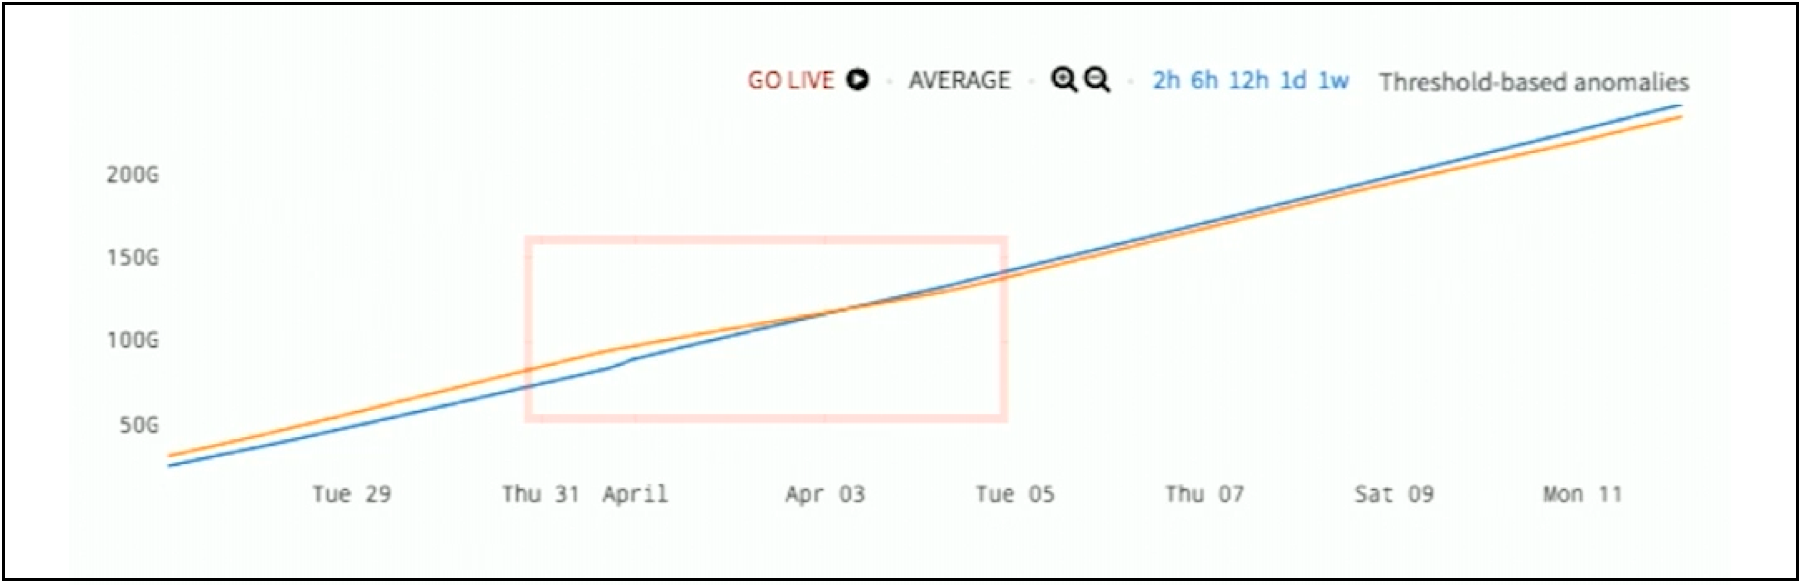 Figure 7. Two Counters Data
To make sense of the data, we need to take a rate as these metrics are counters. If we use a rate function in the chart in Figure 8 below, the anomaly is obvious. The blue line actually jumped up for a bit, the orange line dips down for a couple of days before it comes back up, but we couldn’t see that in the previous chart; it’s all hidden. With constant rate alerting, the anomaly becomes obvious.
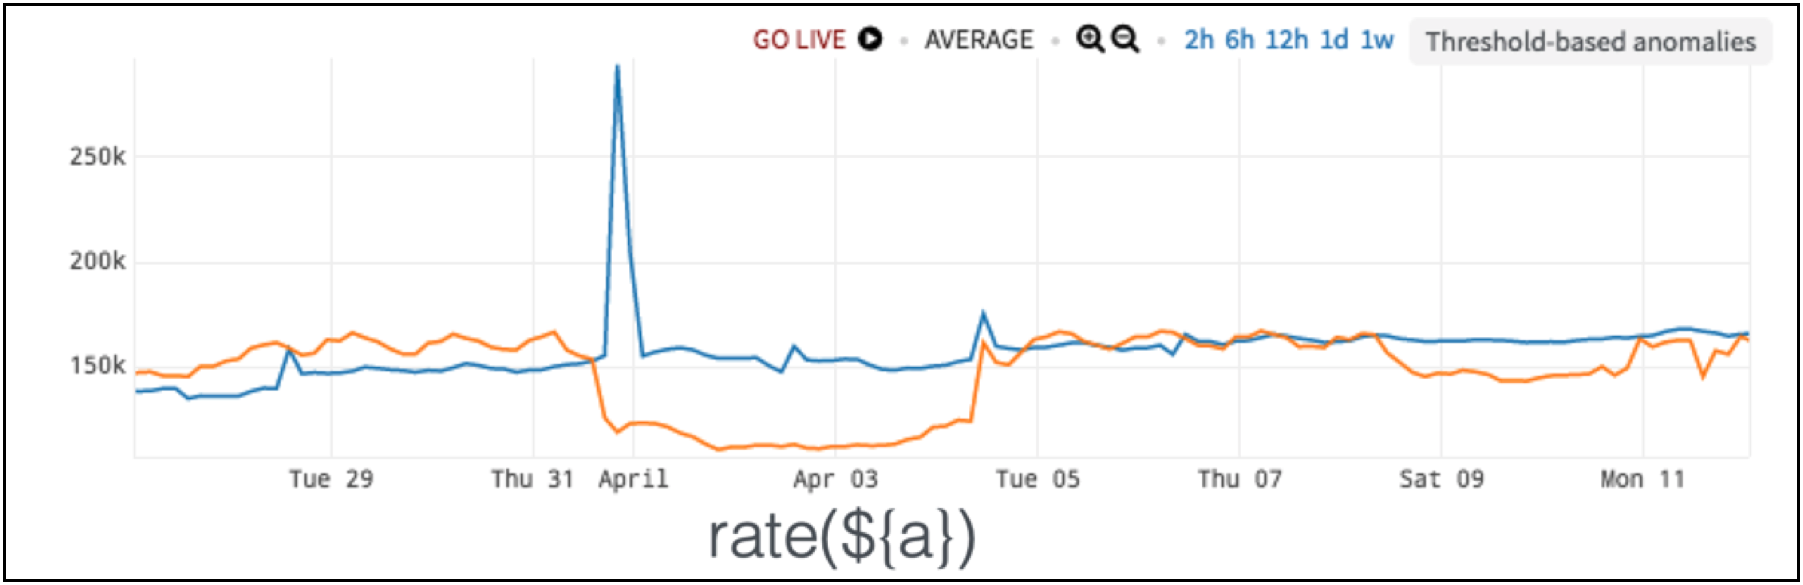 Figure 8. Detecting Counters’ Data Anomalies with Constant Rate Alerting
So, normal for this dataset is a constant rate.
5. Alerting on a Group Range Anomaly
Here, in Figure 9 is a serial pipeline of data. This data pipeline shows throughput rates at each stage of the pipeline. In this case, you can see the pink line at the bottom is the output – the final stage of throughput. That stage drops way down, and the rest of the lines actually increase. In short, we have a stall in the pipeline.
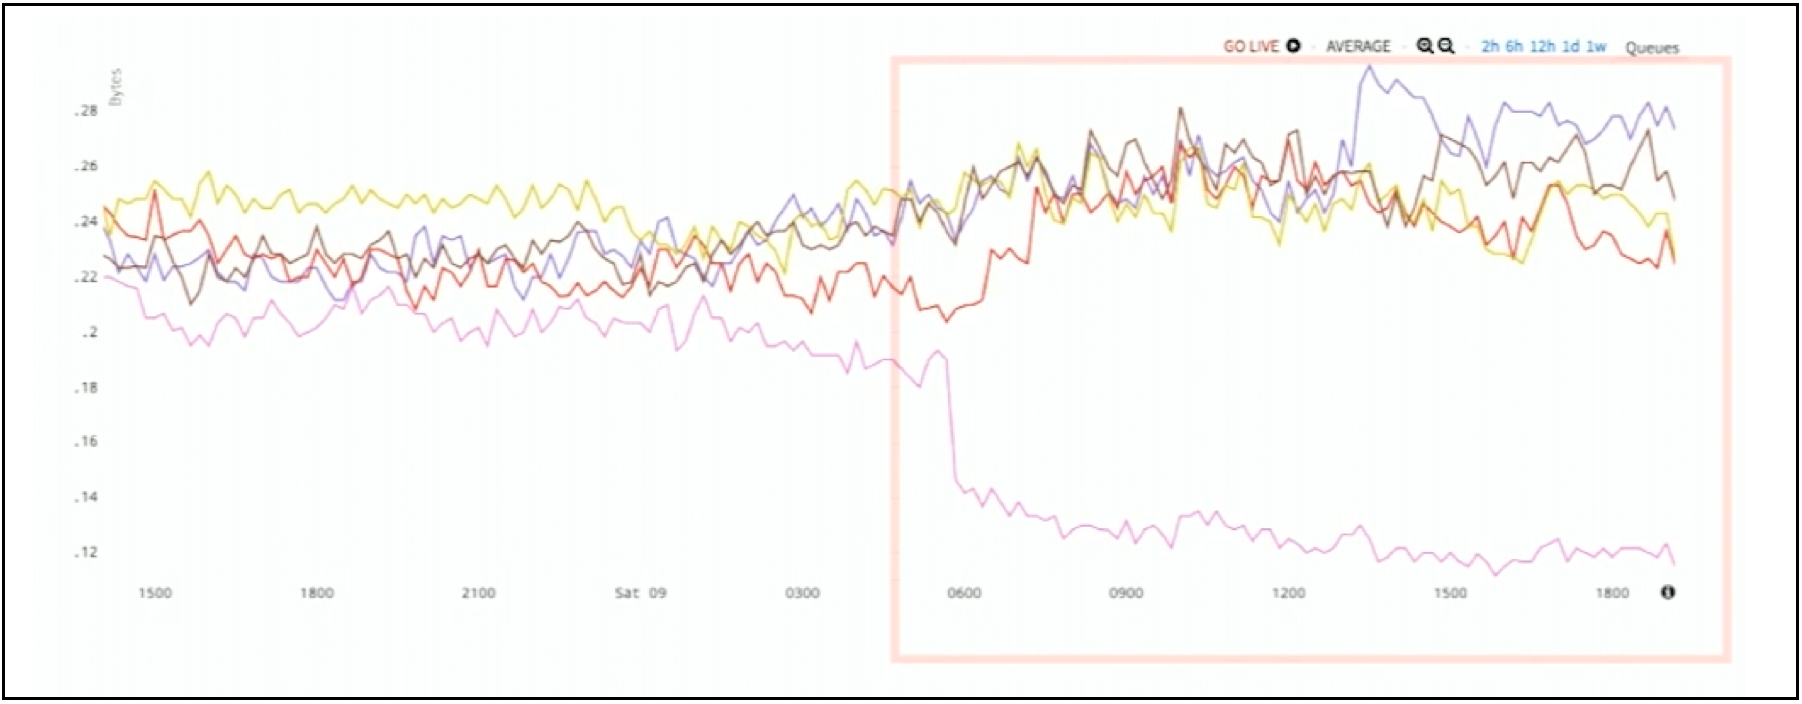 Figure 9. Throughput Rates of Serial Data Pipelines
Points are getting dropped or getting delayed for some reason, and here the anomaly is the divergence of the top and the bottom lines of this chart. You can actually take a max, subtract the min, and see what that should be. The anomaly is very obvious to see.
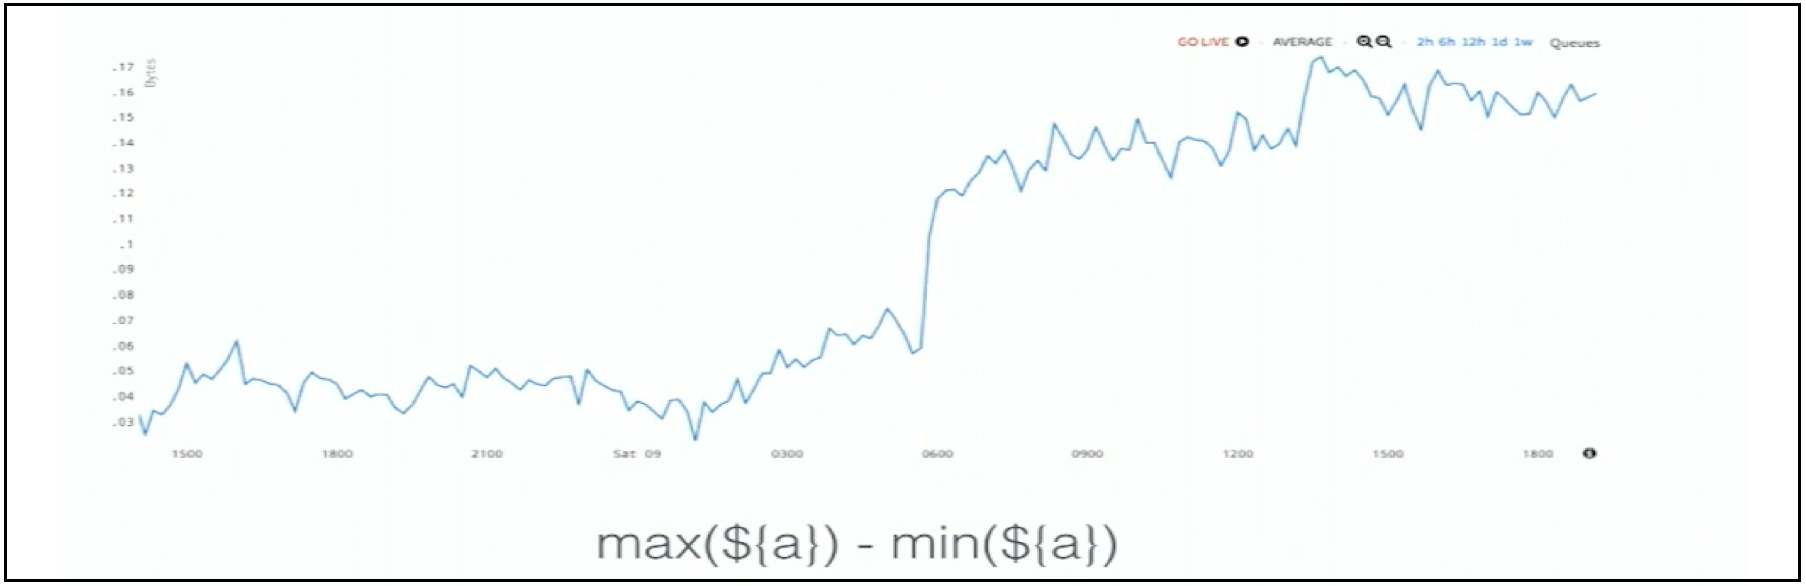 Figure 10. Group Range Alerting for Discovery of the Net Stall Thru Pipeline
This is essentially the net stall through the pipeline. In this scenario, normal for the group range is low. When it gets higher, that is the anomaly.
In the next part 3 of our 4-part series on auto-detecting cloud app anomalies with analytics, I’ll continue with the next set of alerting examples, some more sophisticated – and very powerful – examples of using analytics to find hidden cloud app anomalies. If you want to try Wavefront in the meantime, sign up for our free trial.
Get Started with Wavefront Follow @mikempx Follow @WavefrontHQThe post How To Auto-Detect Cloud App Anomalies with Analytics: 10 Smart Alerting Examples – Part 2 appeared first on Wavefront by VMware.
About the Author
More Content by Mike Johnson


