

One of the most common use cases for Wavefront is not just understanding the present, but predicting the future – whether it’s capacity planning or forecasting a potential problem. This can be especially tricky when the data in question shows some kind of seasonality: daily, weekly, or annually. While working with this kind of data can be done by composing existing Wavefront functions together, we’re pleased to announce the release of a new function that makes this as easy as two letters — namely, h and w, which collectively stand for “Holt-Winters”.
Holt-Winters is a time series analysis technique for seasonal data that dates back several decades, making it an extremely well-understood and broadly-used approach. In the market today, there is lots of hype about machine learning and AI today, but, Holt-Winters algorithm has actually been tried and tested. It has been used to forecast everything from vegetable crop productivity to financial exchange rates to Australian tourism volume. And with the new hw() function, you can apply this technique to any of your Wavefront data in mere seconds.
One way to think about seasonal data is that it consists of three parts:
- The ‘level‘, which is the average current value of data;
- The ‘trend‘, or consistent increase/decrease of the data over time;
- The ‘seasonal component’, which varies up and down during some regular time period.
Holt-Winters uses this three-part decomposition to predict the future of your selected time series. Let’s take a look at some actual data to see how this all works.
Here we have a chart showing the login rate to a large web site over the course of a few weeks (in blue)
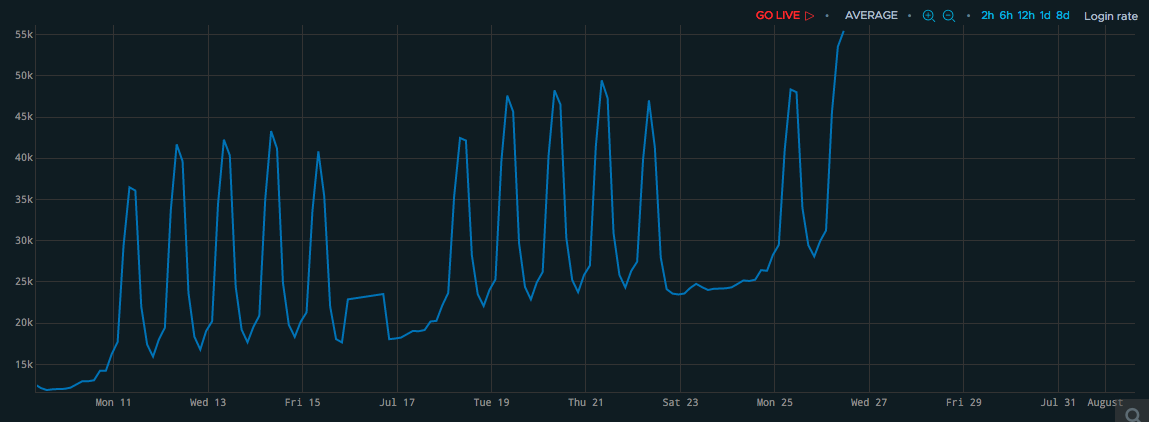
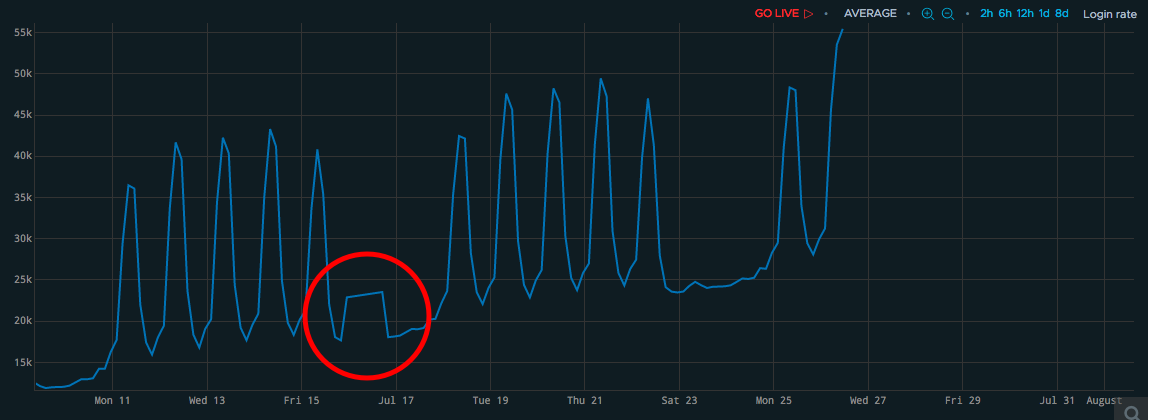
We can immediately see some interesting patterns — there’s spikiness each day of the week, as people mostly log in during the day; there’s spikiness during the weekdays vs the weekends; and finally, there’s an overall trend as each week tends to rise above the last. You can see the data stops on the second spike of our current week (Tuesday mid-day), and we’d like to understand what’s going to happen during the rest of the week. Note that the past data is a bit noisy, and there’s a weird box artifact during one of the weekends (circled in red):
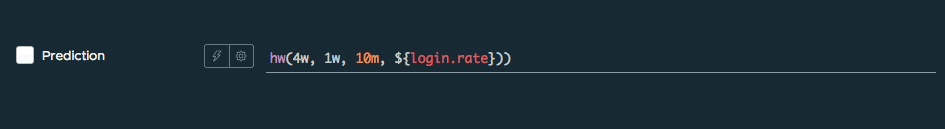
With Wavefront, we can call the hw() function to forecast this data’s continuation, integrating all three of the components (level, trend, and seasonality), even with some irregularity (as circled in red) in the past. We provide three arguments to the function — the lookback window (here, 4 weeks), the dominant period of the data (here, 1 week), and how frequently to fill in forecast points (here, 10 minutes):
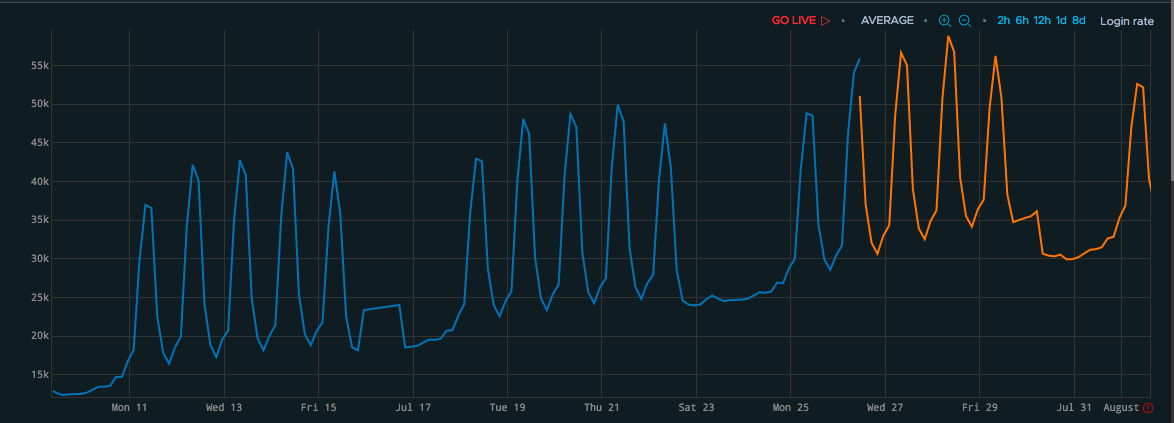
If we run this expression, we can see just how well the hw() function in orange completes the original data (in blue), capturing the daily and weekly variation, and maintaining the upward trend quite smoothly.
Now, imagine all the use cases you could perform with this functionality:
1.) ANOMALY DETECTION: Use Holt-Winters to ‘predict’ the present from the past; if the current value is far enough away (based on standard deviation, for example), you have an anomaly.
2.) PREDICTIVE SCALING: Use Holt-Winters to predict the upcoming demand of some seasonal resource based on recent history, then scale up in advance to avoid any hiccups.
3.) CROSSOVER WARNING: Use Holt-Winters to chart two different time series to understand when they will cross over each other, taking all their ups and downs (literally!) into account.
We’re just getting started with more advanced time series analytics – look for many more functions and visualizations to come. If you want to learn more about the power of predictive analytics and using Holt-Winters on your own data, sign up for our free trial.
Get Started with Wavefront Follow @panghy Follow @WavefrontHQ
The post Expanding Wavefront Predictive Analytics – See the Future With Holt-Winters Algorithm appeared first on Wavefront by VMware.


