

In conjunction with VMworld 2020, we are announcing new functionalities of Tanzu Observability by Wavefront that accelerate analytics-driven insights and data onboarding for DevOps teams, including developers, Kubernetes operators, and wider operations teams. We have added support for PromQL, expanded packaged application insights, and grown the Tanzu Observability ecosystem—both within the Tanzu portfolio and outside of it—by adding support for popular DevOps and developer tools. Read on for a rundown of the new capabilities.
Seamless PromQL support enables flexible and easy migration to enterprise observability
Tanzu Observability now supports Prometheus Query Language (PromQL). In other words, you now get the best of both worlds! With our PromQL support, we have unified the open source monitoring with enterprise observability. Developers, SREs, and Kubernetes platform operators can use Prometheus queries to power Tanzu Observability dashboards and alerts. And with this full PromQL translation to Wavefront Query Language, you can easily migrate your Prometheus data to Tanzu Observability while taking advantage of high availability and 18 months of retention with original data resolution granularity.
Teams have the flexibility to continue using Prometheus or fully migrating it to Tanzu Observability so they can take advantage of the richer Wavefront Query Language, which offers additional functions such as neural networks-driven anomaly detection. Should you choose to migrate, you can do so in phases. We make it easy by supporting all Prometheus queries and data types combined with auto-completion of those queries along with any alerts. To learn more about PromQL support, check out the documentation or join our upcoming webinar to learn about it live.
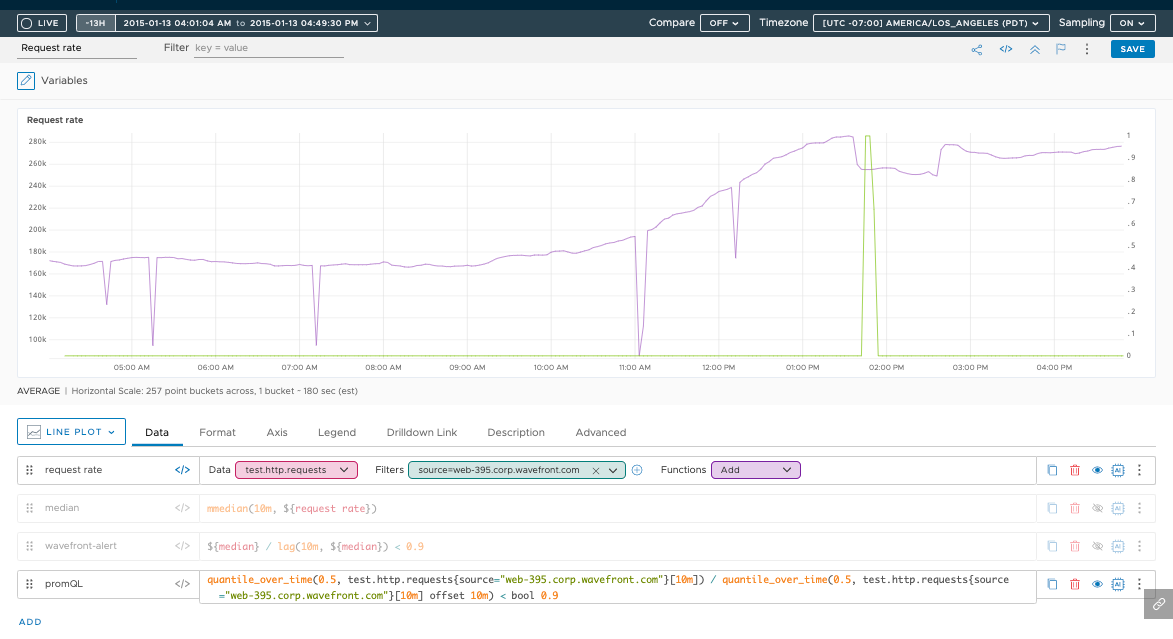
PromQL support in Tanzu Observability
OpenTelemetry support and APM metrics expand application visibility
Since we first announced our support for distributed tracing, we have continued to invest in expanding application observability by offering more prepackaged application performance insights for operations teams and developers. These application observability enhancements are highlighted below.
OpenTelemetry-compliant distributed tracing provides greater flexibility
Distributed tracing is very popular with Tanzu Observability customers for troubleshooting the performance of microservices-based applications. We are happy to share that, in addition to our prior OpenCensus/OpenTracing support (which merged into OpenTelemetry), our platform now supports OpenTelemetry as well. Using the OpenTelemetry collector, you can now send application metrics, traces, and histograms to Tanzu Observability. Together with all the other metrics, you get deep insights into your applications that enable you to quickly navigate to the potential source of any bottlenecks or delays, set up alerts based on tracing-derived Request Error Duration (RED) metrics, and/or understand any custom business metrics. Learn more about OpenTelemetry support.
App Maps’ external end nodes deliver last-mile services visibility
We have enhanced Tanzu Observability Application Maps (App Maps), which are used to root-cause application or microservices issues, with external end nodes support. With this enhancement, you get last-mile services visibility, a key component of complete end-to-end tracing and microservices insight. Whether your microservice is calling an external cloud service API or an external database, you get detailed RED metrics for that communication traffic. This expanded visibility helps you to not only troubleshoot the microservices you develop but instantly identify potential bottlenecks with any external ones. You can also configure views for focused or detailed analysis or configure error and latency thresholds to match the unique nature of your application.
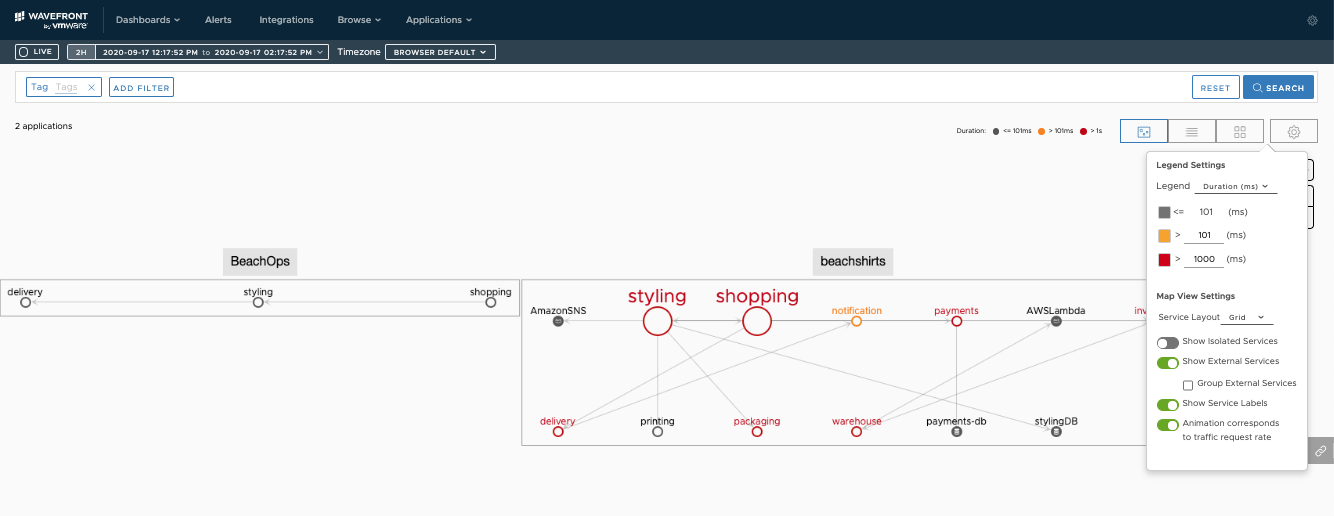
Easy troubleshooting with App Maps and external nodes visualization
Tanzu Observability & Catchpoint provide digital experience insights
We also have added the Catchpoint plug-in, which allows our mutual customers to bring various synthetics metrics into the Tanzu Observability platform. These user metrics are highly granular and include browser load time, file download times, and network availability. They can also be combined with all other metrics, such as those around Kubernetes performance, for holistic observability. Check out our docs to learn more about this offering.
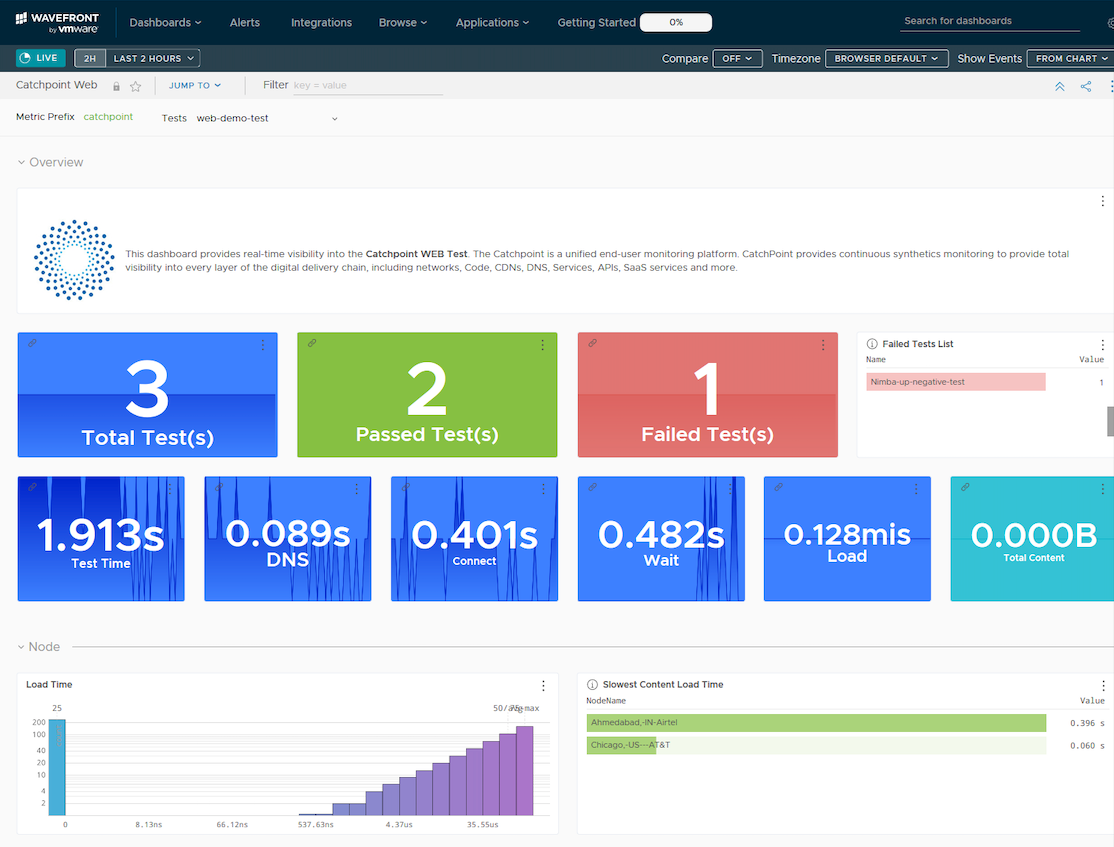
Tanzu Observability Catchpoint integration for digital experience monitoring
Apdex Score tracks user satisfaction
Tanzu Observability now provides instant Apdex scoring for microservices, which is a way for application owners to measure perceived user satisfaction with their cloud services that is widely accepted throughout the industry. Using Apdex, admins can set expected service satisfaction thresholds as well as related alerts. Our Apdex score visualization helps you get real-time and historical user satisfaction trends or instantly troubleshoot the lowest-performing service from the application map by combining it with Tanzu Observability histograms.
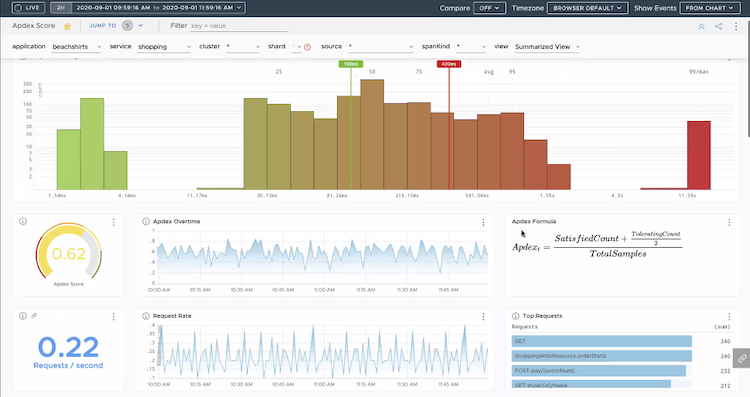
Track user satisfaction using Apdex
An expanded Tanzu Observability ecosystem delivers faster insights
We are excited to announce a number of new plug-ins—including VMware Tanzu Mission Control, Spring Cloud Data Flow (SCDF) Pipelines, and Terraform—that are in high demand by our customers
Tanzu Mission Control integration generates instant Kubernetes insights
With VMware Tanzu Mission Control and Tanzu Observability, we are unifying centralized multicluster Kubernetes management with full-stack Kubernetes observability and analytics. This integration further enhances Kubernetes operators’ ability to efficiently manage multiple Kubernetes clusters across multiple clouds while enabling developers to have more flexibility and autonomy. You can install the Wavefront Kubernetes collector on any cluster with a single click. After the Wavefront Kubernetes collector is successfully installed, you’ll be able to access the Tanzu Observability platform directly through the Tanzu Mission Control UI.
Once the data is in Tanzu Observability, Kubernetes operators can observe the health, performance, and availability of individual clusters. Beyond top-level summary metrics, the Wavefront Kubernetes collector takes in core Kubernetes metrics, including clusters, namespaces, nodes, pods, containers, CPU, memory metrics, and much more.
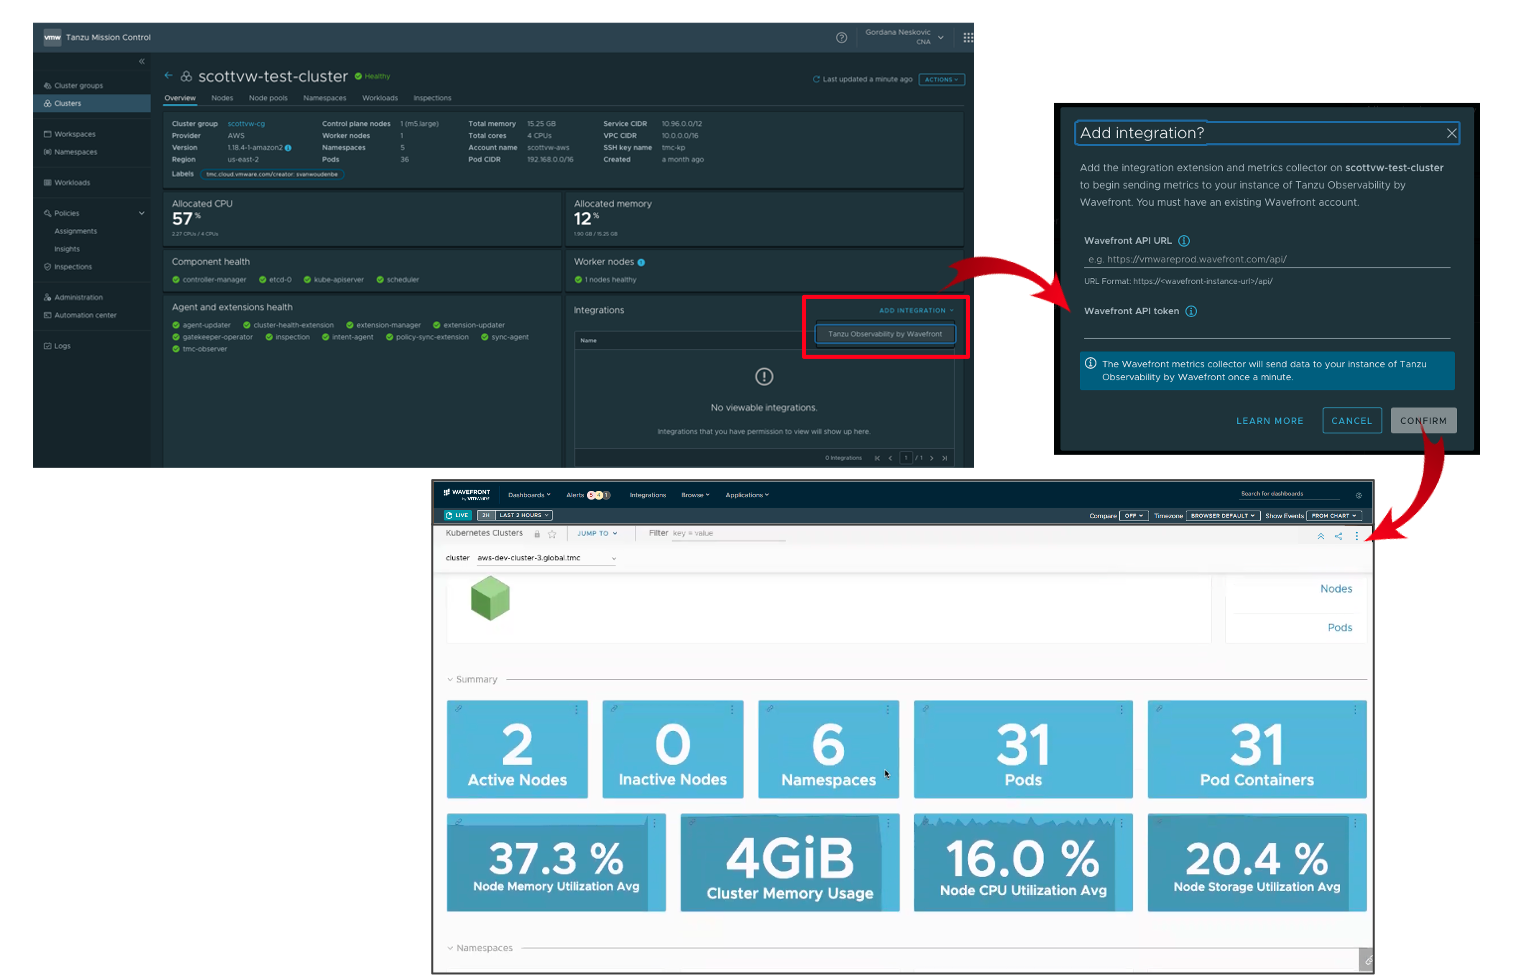
Integration of Tanzu Observability and Tanzu Mission Control
Visualize the data journey of your Spring Cloud data flow pipelines
We expanded our Spring Boot applications’ comprehensive observability with SCDF plug-in. For developers who design, develop, and continuously deliver SCDF data pipelines locally, on Tanzu Application Service or Kubernetes, we provide instant insights with real-time metrics such as throughput, latency, and error and message rates. We provide you with all the information you need to find bottlenecks and optimize pipelines or reduce service-level objectives related to task pipelines. To learn more about this offering, be sure to check out this post.
Use observability-as-code to manage your dashboards and alerts
Tanzu Observability’s work with Terraform eliminates error-prone manual installation, which allows you to manage your dashboards and alerts the same way you use Terraform to manage your cloud infrastructure.
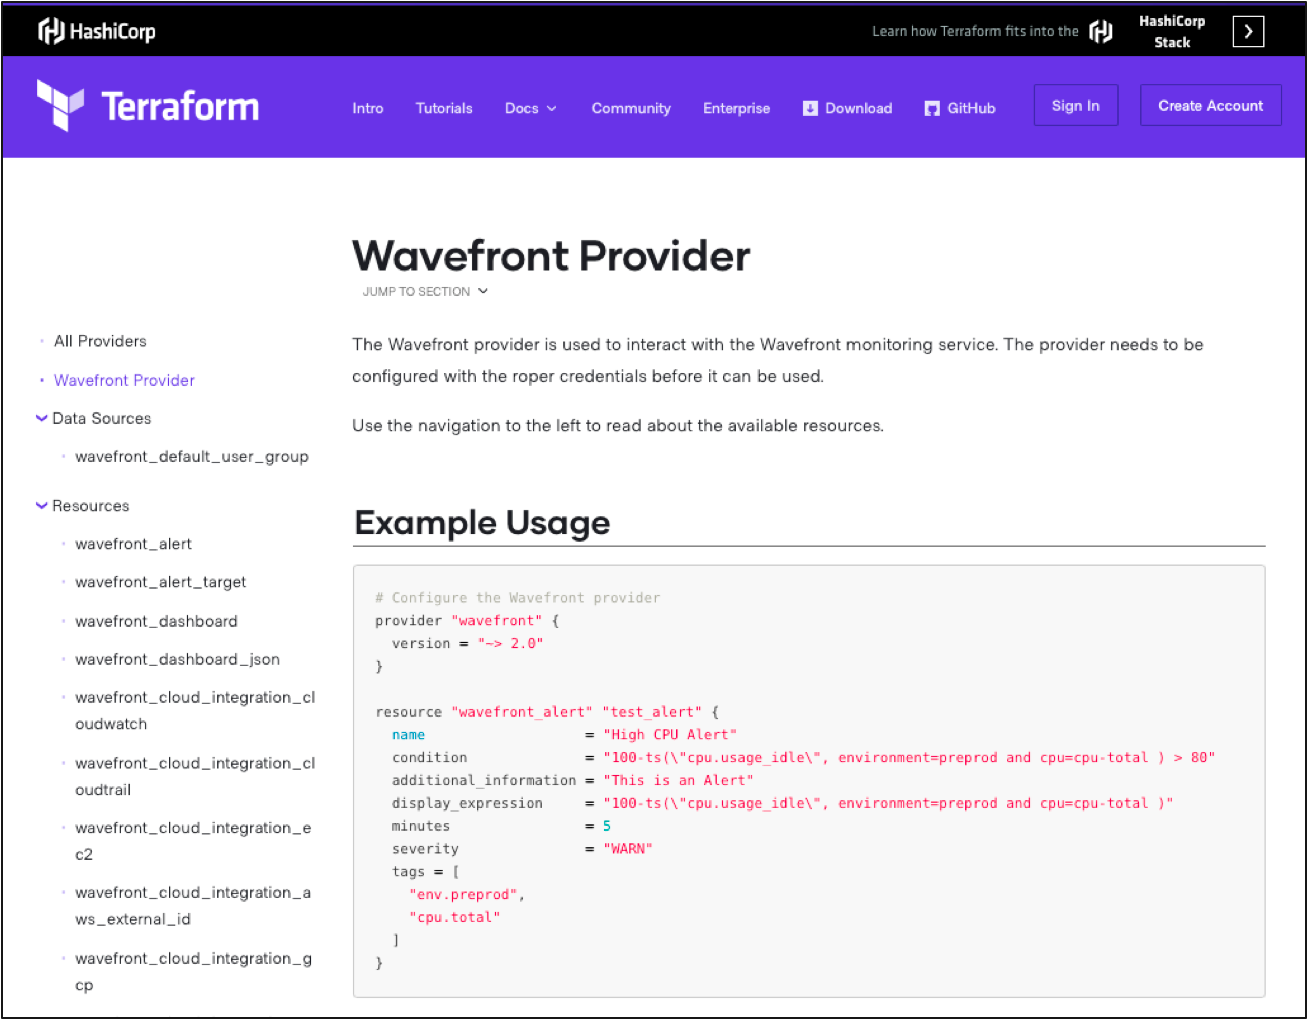
Terraform-managed Tanzu Observability alerts and dashboards
Interaction with Tanzu Observability resource objects such as alerts and dashboards have never been so easy. Using Wavefront Terraform Provider, you declare your desired Tanzu Observability object, such as an alert, in the Terraform file, run the Terraform file with the desired changes, then go into Tanzu Observability to access your declared object. Check out the video below to learn more about how to use Wavefront Terraform provider.
Enterprise cloud objects get more secure
We are continuously improving the security features of Tanzu Observability to protect your sensitive data across enterprise cloud applications. To that end, we have added granular metrics security for organizations whose security access needs vary among their cloud assets. We have also added self-service single sign-on (SSO) for faster user onboarding.
Enhanced metrics security
Tanzu Observability now has per-metric access control security that enables you to hide or reveal confidential data at a metrics level based on role, group, or account type, with no need for separate clusters. Some vendors secure access to sensitive metrics using a new cluster, creating silos and impacting the correlation ability during data analysis. With our patent-pending metrics security feature, you can simultaneously limit access to time series data on a need-to-know basis and preserve the ability of your users to correlate different sources of information—all within a single cluster.
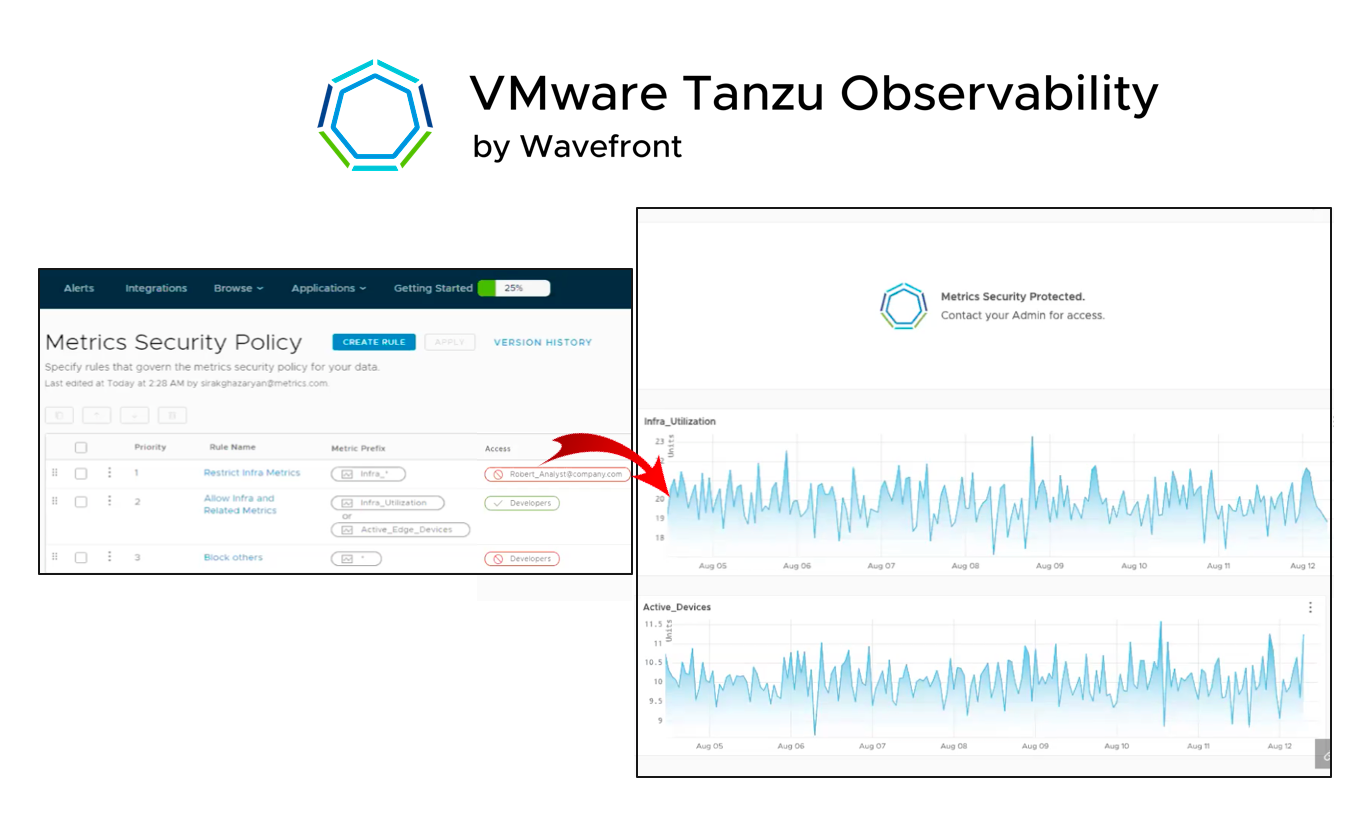
Secure confidential metrics at a fine-grained level
Self-Service SSO
For quick user onboarding, the Tanzu Observability platform now offers self-service SSO SAML. You don’t need to contact our operations or customer support to restrict and manage user access to services. With three easy steps—none of which involve error-prone manual installation—you can manage access to your service. And to prevent unauthorized access, you choose your authentication solution—be it Okta, GoogleID, or AzureAD—and change it whenever it suits you.
To try these and many other exciting Tanzu Observability capabilities, sign up for our free trial.
See Tanzu Observability at VMworld
If you are attending VMworld, please attend the Tanzu Observability sessions below:
|
Session ID |
Breakout Sessions |
|
Customer Story: Monitoring Kubernetes and beyond with Tanzu Observability |
|
|
Always-on Service for Millions: K8S&Observability Best Practices for SREs |
|
|
Cloud Observability Frameworks for Modern Application Platforms |
|
|
Best Practices for Zero Downtime TAS & K8S Deployments |
|
|
Catching the Serverless Wave with Azure Functions and Tanzu Observability |
|
|
Auto-Observe Your Spring Boot Applications with Tanzu Observability |
|
|
Expert Roundtable – Tanzu Observability by Wavefront |
|
|
Building Observable Microservices |
We are looking forward to seeing you at VMworld 2020!
About the Author
Follow on Twitter Follow on Linkedin More Content by Stela Udovicic


