

In my last blog, I reviewed basic metrics vs. logs differences. In this final blog of the series, I will dive into the comparison further and help you recognize situations when it’s better to use metrics and when logs.
Let’s start with a comparative analysis of logs vs. metrics, summarized in the figure below. Both metrics and logs can be used to drive actionable insight, and both can be searched. But as metrics are numbers, their compression rate is much higher than logs that represent text records. Given that, metrics can be stored, processed and retrieved at a fraction of a cost compared to logs (up to 10x). One can use Wavefront’s metrics to ingest, process and visualize at volumes exceeding a million points per second.
Another important difference is that metrics are typically used to get a broad, system-level view across your entire application and cloud infrastructure. With centralized metrics and alerting, you can get an early indication of service level anomalous behavior which helps avoid customer facing issues.
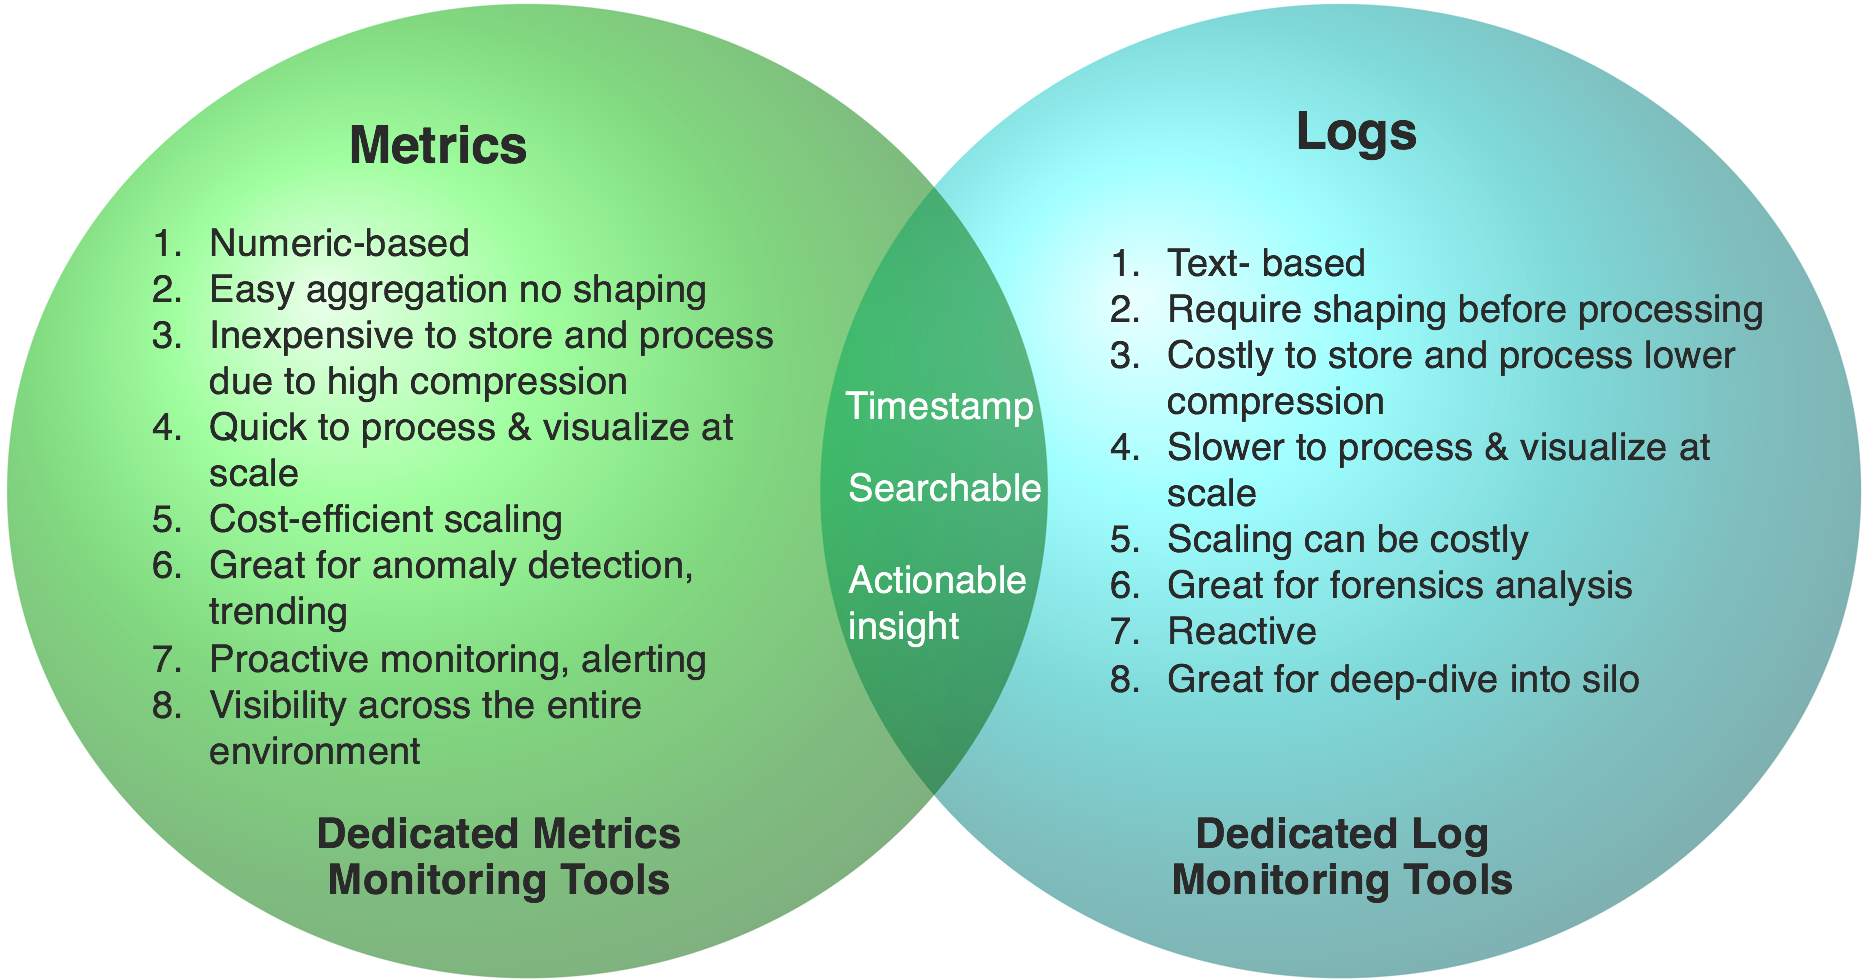
Unlike metrics, logs are mostly optimized for forensic, “after the fact” type of analysis. As we will discuss further, logs are also good for the drill-down kind of analysis. You can analyze logs with tools such as Splunk or Loggly in the commercial space; the ELK stack or Graylog in the open-source space. When it comes to metrics focused tools, you can use Wavefront in the commercial space, while legacy Graphite and OpenTSDB remain in the open source space.
When to Use Metric Analytics and When Log Analytics?
Iterative Investigation: Use Metrics
Metrics are better suited for use when you are performing iterative investigation across distributed applications and cloud services. Imagine a situation where a key cloud service goes starts experiencing increased latency – say your company is using Workday (a Wavefront Customer) and due to this issue, it delays your payment processing.
Using the speed of metrics analytics and anomaly detection across entire service, Workday’s DevOps team can see a leading indicator of an outage within a couple of hosts. With Wavefront’s moving window dashboards, they can instantly see a seasonal anomaly, again for example, in the last quarter at the same time they observe a similar behavior resulting in a portion of their application services becoming unresponsive.
With aggregated views delivered from metrics, they can quickly isolate a system level anomaly and zero-in to the infrastructure zone that’s affected. They can alert proactively on the start of strange behavior. On the other hand, they may not particularly care much if just a small % of their servers is running hot when the overall service is healthy.
Running Many Microservices and Containers: Use Metrics
Due to their compact form, metrics are a great option when you’re running and need visibility into many microservices, containers, and clusters. With rising numbers of microservices, and as your code grows, you need to add many more measurement points. The multiple additions of 100 more metrics or even 1,000 more should not incur a huge jump in your processing costs, fill up your disc space quickly, or add significant delays in data processing and visualization.
Continuous Delivery: Use Metrics
Metrics are essential when you’re doing continuous delivery with many code pushes to production. Continuous code pushes require continuous measurement and iteration, and continuous communication. In that scenario, DevOps teams, as well as developers, have a very short time to react to remediate a potential incident. Due to instant visualizations of a potentially massive number of data points per second, metrics are well suited for continuous delivery.
Drill-down, Forensic Analysis: Use Logs
Since logs are meant to provide you with very specific, detailed information, they are a very good option when you have to drill deep into a silo sub-system to understand the exact details, for example, why a particular network switch misbehaved around a specific event. After something has happened, logs will give you a wealth of forensic information so that you can use to help debug the issue. Logs are also particularly useful when you have enough time to troubleshoot and isolate the problem, e.g. during forensic post-mortems. This is often the case when you’re not doing many production code pushes. Logs are also very useful in security incident investigations, as they are great for forensic analysis.
When Deriving Metrics from Logs Make Sense?
Even though in many cases you do need a specialized metric or a logging tool to take advantage of architectural and cost optimization, I’m seeing that some of our customers are creating metrics from logs. They want to benefit from the speed and cost processing of metrics, and also when they already have a logs collection tooling in place.
Another important reason is the long-term retention of metrics is much more cost efficient particularly at volume. Long-term retention becomes essential when you’re performing a historical analysis of your application and cloud services behavior.
The Wavefront platform gives you several ways to create metrics from logs, no matter your collection method is, e.g. if you use Splunk software, or the ELK stack or any other logging tool; you can even send logs using TCP. Please refer to our on-demand webinar for more details on how to create metrics from logs or read our documentation.
Benefits of Creating Metrics from Logs
When you create metrics from logs for your cloud applications and then analyze them in Wavefront you typically get:
- Insight into an aggregate behavior of your applications and infrastructure at scale and the ability to understand system level anomalies. This is highly relevant for modern cloud environments and velocity of application change.
- Significant cost saving, as comparable information stored in logs, will cost you up to 10 times more in processing and storage cost. Metrics are extremely efficient to store and process. Assume you have to analyze and trend several weeks’ or months’ worth of data to understand the spike that occurred in your environment. If have to wait for your tool to crunch the data until you come back from lunch, well you are not iterating quickly, as is required in continuous delivery mode.
- Unified alerts and metrics can help react on the true glimpse of something wrong before it develops into the veritable “oh sh*t” type of trouble. Metrics help you detect and alert on unpredictable behavior change across everything even before customers are impacted…yet. And then you only have one integration point with DevOps toolchain – like HipChat or PagerDuty – to start that collaborative sharing.
- Metrics can help you alert on the overall volume of logs. Say, all of a sudden, you have a spike in cloud applications’ logging; it can be an early sign of trouble that can ripple across your distributed environment.
Case Study: Leading European Energy Supplier
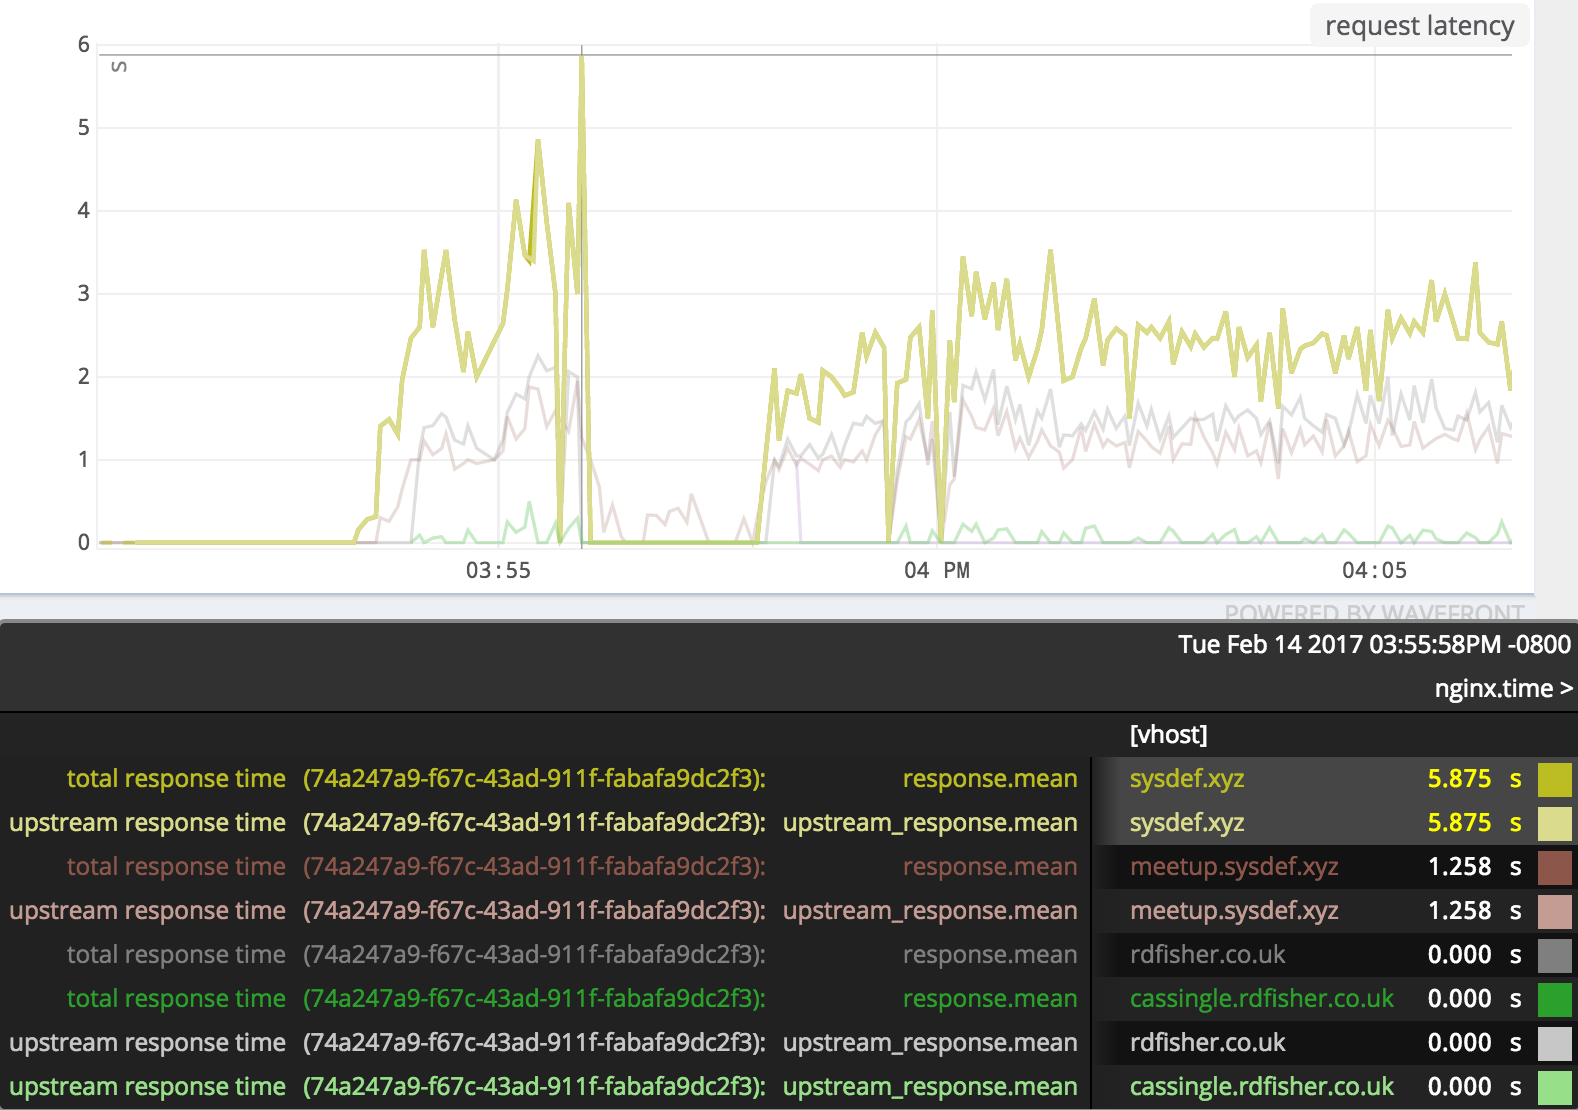
British Gas, a Wavefront customer, is creating metrics from logs and gaining holistic visibility into their cloud applications. They are also monitoring their ELK stack and alerting using Wavefront. In his detailed blog, Rob Fisher, SRE team member at British Gas provides a detailed step-by-step guide and walks you through an example inspired by their use case. He describes how you can use metrics derived from logs in Wavefront to help you troubleshoot if your NGINX tier is a cause of your cloud application latency under increased load.
Summary
It’s time to summarize. Using specialized and architecturally optimized platforms for metrics and logs will give you the most operational and cost advantage. Wavefront Unified Metrics Analytics platform is essential to give you a holistic view, speed, and scale required in today’s digital enterprise where software complexity and associated code base are growing rapidly.
Finally, if you already have log collection pipeline in place and would like to get the unified view, speed, and scale that only metrics analytics can offer, use Wavefront software to create metrics from logs.
Get Started with Wavefront Follow @stela_udo Follow @WavefrontHQ
The post Metrics vs. Logs Dilemma: Selecting the Right Platform for Monitoring Your Cloud Services (part 3 of 3) appeared first on Wavefront by VMware.
About the Author
Follow on Twitter Follow on Linkedin More Content by Stela Udovicic


