

The ability to see your data in a myriad of different ways is a cornerstone of modern monitoring, whether you are on pager duty for a thousand enterprise microservices or trying to figure out which code update caused a slow response time of your website.
Wavefront’s dashboards enable the real-time insight that helps you perform meaningful analysis and make data-driven decisions. Here, we will explore three key aspects of Wavefront’s dashboarding functionality that will help you get value with Wavefront quickly.
These examples will also help you reduce your headaches and help your DevOps, CloudOps and development teams gain real-time insight into the performance of your critical services regardless of infrastructure and application technology in use.
Dashboarding freedom: Create your own or start with packaged analytics
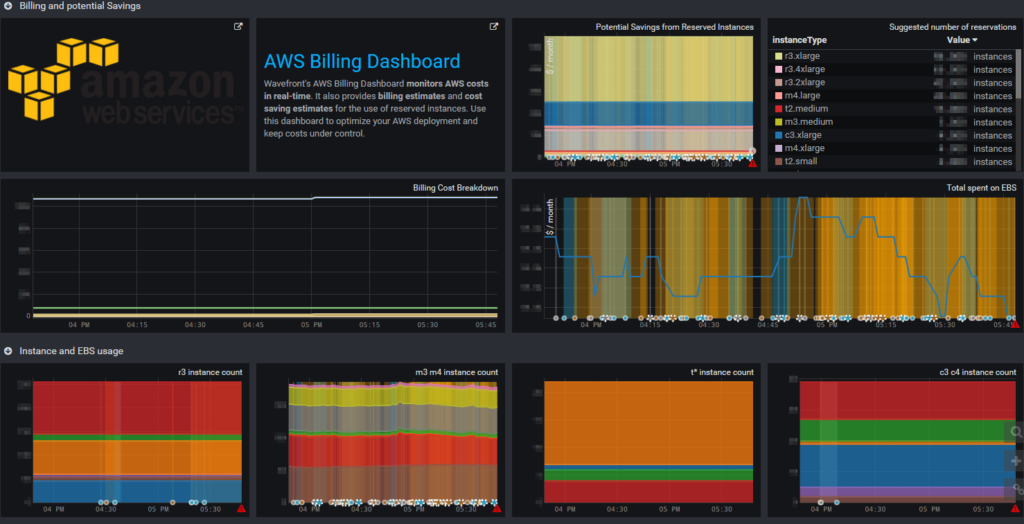
Based on the varied needs and technologies of our customers, we developed an extensive library of dashboards. For example, by connecting Wavefront to your AWS account, a dashboard that analyzes your AWS usage and cloud spend is automatically deployed into your AWS account.
It helps you monitor your billing and recommend instance reservations, leading to significant potential savings.
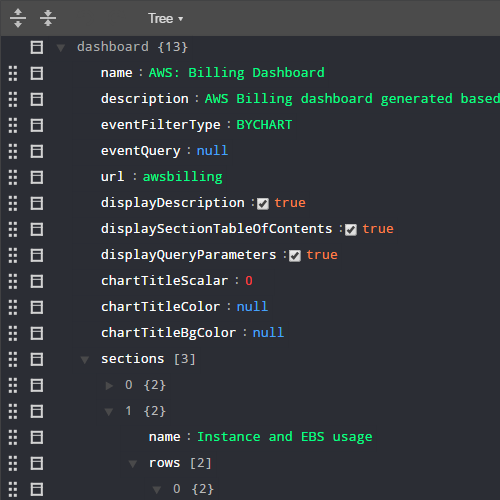
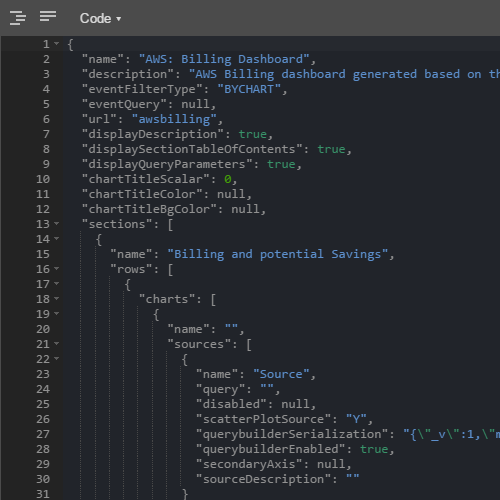
Often, a pre-baked UI doesn’t cover specific needs and requirements of every organization or even individual teams within an organization. Wavefront’s dashboards are highly flexible, and can be edited using a drag-and-drop user experience, or the built-in JSON editor:
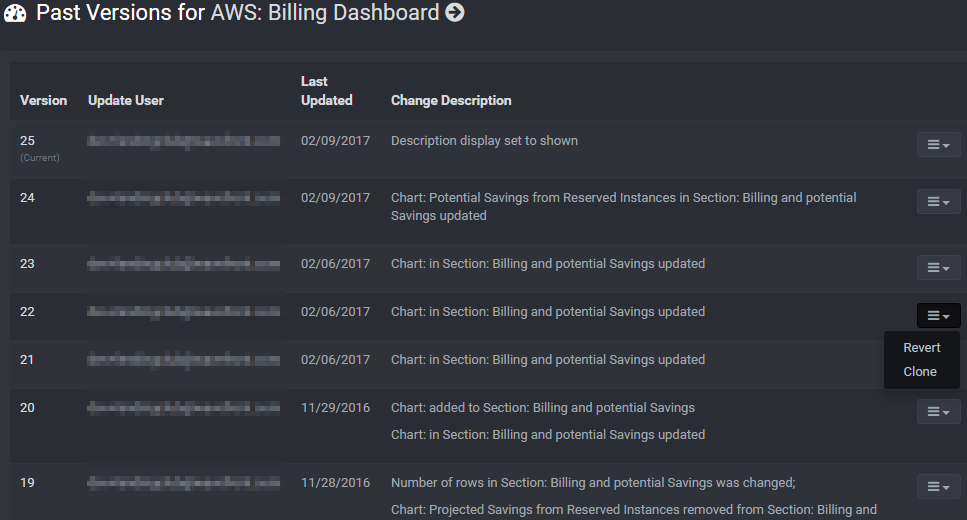
Wavefront dashboards support full change tracking, version management and even direct cloning. From the very start of deploying Wavefront in an organization, its usage often spreads rapidly.
Within a short time, typically, there are hundreds of monthly active users across the DevOps, CloudOps and TechOps teams creating and sharing custom dashboards.
The power of sharing has a direct impact on critical service reliability and the speed of code delivery as well as incident resolution for a modern digital enterprise.
Due to Wavefront’s visualizations flexibility, our customers adopt dashboards quickly and have a quick transition from their old outdated tools. After you give it a try, you will soon realize the ease of use can help you replicate almost any dashboard you have and build upon any workflow you are used to.
For example, when you want to stop wasting precious development time using and maintaining open-source monitoring tools such as Nagios, Zabbix or Graphite.
Every Wavefront account comes bundled with common dashboards, including one that helps you monitor your usage of Wavefront. As you bring more data into the Wavefront cloud service, you’ll get instant value from other pre-built dashboards for technologies like Docker and Kubernetes.
Dashboarding automation: Operationalize your runbooks
Using runbooks for either infrastructure automation or incident resolution has long been considered an industry best practice. Almost always, runbooks are maintained as separate reference documents from the tools you use to manage your alerts and monitor your systems or applications.
Often, separation can lead to infrastructure drift, in particular when teams increasingly rely on dynamically changing environments and rapidly evolving tools. How many times have you reviewed a runbook to find that there are no screenshots, or the screenshots are out of date? How long did it take you to troubleshoot and resolve a performance degradation or production incident?
With Wavefront, you can bake your data and analysis into your runbooks through the intelligent use of dashboard elements like the Markdown widget (for documenting notes):
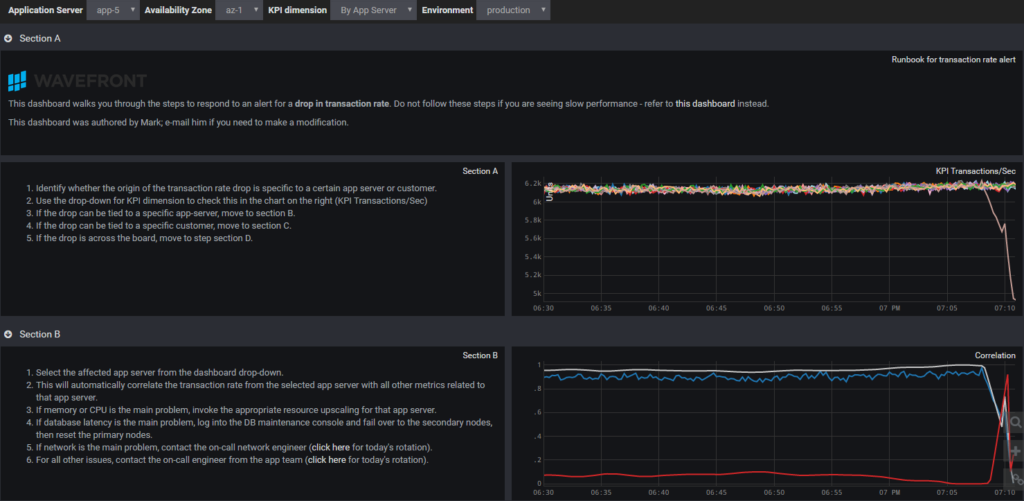
When your runbook procedures are integrated with the data and tools you need to review, then you can:
- Minimize drift between data, tools, documentation and tribal knowledge
- Empower less experienced engineers and reduce reliance on key resource bottlenecks
- Lower context switching and associated mistakes
All of these factors reduce your MTTR and your effective costs of maintaining SLAs, whether they are internal- or external-facing. Runbooks also reduce stress on senior engineers. They enable all your on-call staff to have procedures and data side-by-side.
Dashboarding dynamism: Explore, drill-down and share
When considering using dashboards versus static reports, the primary value of a dashboard should be interactivity. Interactive dashboards enable iterative investigation, a faster way to find anomalies. The ability to change the scope of a dashboard goes beyond the time window. It should also include the ability to modify how you’re looking at the data at a fundamental level.
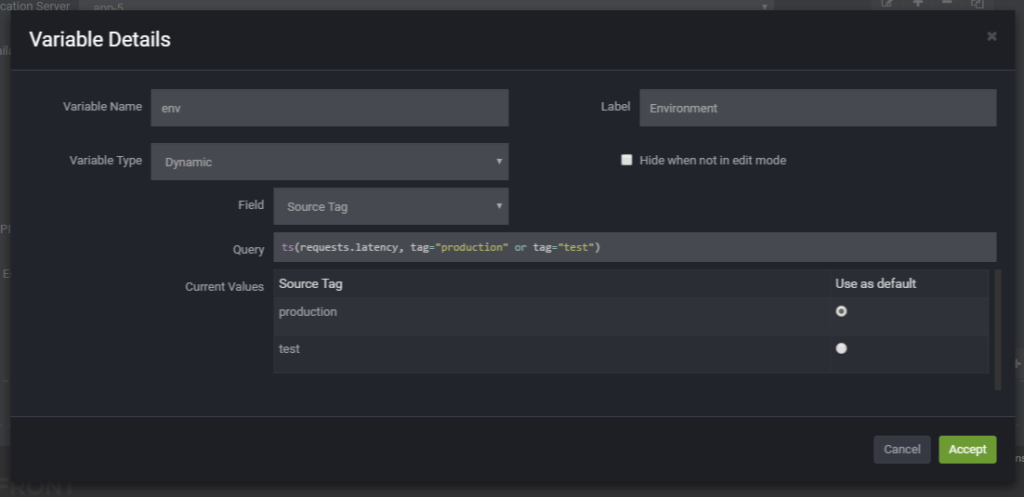
Wavefront’s dashboard variables unlock a powerful point-and-click interaction with the underlying ts() queries that build out the charts and widgets on any dashboard, without exposing complexity to the user. This allows the most technical power user to share his or her latest method for finding problems and data analysis, without then becoming a bottleneck for scope modifications, big or small.
You can change the dimension of data being displayed, e.g. view all environments, or just production. Or, you can completely alter the underlying query: calculate the standard deviation against the last month, or simply the raw difference, today versus yesterday. Dashboard creators can define dynamic, query-based values from the data set itself without tedious manual entry of lists.
Just like there is no single pane of glass, there is no single dashboard that can display high-level and low-level detail simultaneously. Often, you will isolate a problem in a dashboard, but then need to dive into a different, but related workflow using a datapoint you’ve found.
Wavefront software supports external links to create drill-down workflows within your Wavefront account, taking you from one dashboard to another while retaining the context of your exploration.
With all the versatility that Wavefront offers for interacting with your dashboards via variables, time windows, time-series selection, etc., it’s vital that you can share the exact context and views with your team.
Every change to your view of a dashboard is tracked and can be distributed intact via the short URLs you can generate within Wavefront. This helps developers and DevOps teams collaborate, rebuild the code, and resolve critical services or infrastructure issues in real-time.
This is just a sample of how Wavefront’s dashboarding experience supports our customers, from startups to billion dollar enterprises. Kick off your own Wavefront trial and check out more dashboard information and examples on our community site.
Get Started with Wavefront Follow @WavefrontHQ Follow @datasmithing
The post Interactive Dashboards: Three Ways to Get Instant Value from Cloud Metrics and Analytics appeared first on Wavefront by VMware.


