

It never fails to amaze me how they’ve managed to apply Wavefront to a broad variety of use cases, even ones that we never considered when we initially built the platform — and I love seeing their ingenuity in action, whether they’re in SaaS, e-commerce, web-scale, mobile, IoT, finance, retail, or another field.Yet, regardless of their particular applications, many of our customers have the same question: “Why is operational anomaly detection so hard?”
In an age where computers can search 30 trillion web pages in less than half a second, why can’t they automatically figure out if that blip in an operational chart is a real problem or a noisy hiccup? Why aren’t false alarms a “solved problem”? The reasons are surprisingly deep and subtle.
1. THE OPERATIONAL SETTING
First of all, operations is a highly specialized context for anomaly detection. Let’s walk the playing field a bit. We’re not just looking at a small, fixed dataset in a vacuum and trying to find regions that are mathematically interesting. In operations, we have the additional issues of:
- Scale/Dynamism of data
- Asymmetric severity of failures
- Limited time
- Hierarchies of KPIs
- Custom definitions
- Black box accountability
Let’s go through each of these in turn.
Scale/Dynamism of data:
In operations, we’re typically looking at a huge dataset that’s constantly receiving new, streaming data, over a constantly changing set of sources [1]. For a Wavefront customer, this might be a historical set of trillions of points that’s adding millions of shiny new points per second from all over the world. I don’t want to write the inevitable firehose cliché, and you don’t want to read it.
Asymmetric severity:
There are very different costs associated with false positives and false negatives in operations versus in other data contexts. False positives (“false alarms”) may lead to high-cost mobilizations of labor and other resources, and then the inevitable loss of confidence in (and decreasing use) of the triggering system.
On the flip side, false negatives (i.e., missing an actual incident) typically have direct revenue implications (and sometimes, career implications…).
In large companies, the focus and impact of these two types of events are often borne by different groups, adding to the tension of this trade-off. Indeed, these two classes of events really are the Scylla and Charybdis of modern systems management, as anyone who has been on-call for an extended duration will tell you (with a jaded thousand-yard stare, over a double espresso).
Limited time:
In operations, degradation often means lost revenue; in other words, time is money. This means that many heavyweight approaches [2] simply cannot be used because they can’t be calibrated/trained in an operationally relevant time window, especially given the scale of data.
Of course, this also complicates anomaly detection because operational teams can’t wait for the full trajectory of an issue to occur before taking action; they have to recognize the beginning signs and make a judgment call.
This is much like deciding to swing based on the early, distant sense of a baseball pitch that could be either a fastball or a slider — all in the half second before it reaches home plate.
Hierarchies of KPIs:
Not all data sets (or types of incidents) are equal. Some data sets are watched more closely than others; some data sets are closer to the business or group goals than others; and some data sets are more useful in predicting ultimate business/group performance than others.
Sometimes people know what intermediate metrics to watch to manage their KPIs (let’s call them proximal KPIs), and sometimes they’re flying blind, or worse [3].
Custom definitions:
Different people (even in the same role, even on the same team) often disagree on what they want to be notified about. What looks like a crucial early warning to Emma might be an overactive nuisance to Zoe.
Complex technology systems are never really in the binary ideals of ‘perfect’ vs. ‘failure’ — they’re in a constant state of partial degradation. How degraded does a system have to be before it’s considered an ‘incident’? Precisely what percentage of customers have to notice and/or complain? As with any of the Great Questions, this is subjective, perhaps unknowable.
Black box accountability:
Any sort of ‘black-box’ system for anomaly detection inevitably leads to an accountability problem. No system is perfect, and the gap between the ideal state and reality is especially severe with systems that promise to figure out your anomalies for you (with zero effort! and no money down!).
Exacerbating the ‘custom definitions’ issue above, black box systems cannot read Emma’s (or Zoe’s, or anyone else’s) mind to understand what they actually want — which means they often force users to conform to the system rather than the other way around.
Finally, if you don’t understand why something works, it’s very hard to understand in which configurations it won’t work (in the future), or whether it’s even ‘working’ right now. And if you want to improve it yourself…again, which part of “black box” didn’t you understand?
2. WHAT IS AN ANOMALY?
Now that we have some sense of what makes the ops milieu a bit unusual, let’s take a step back and ask the question with (hopefully) more context: What is an anomaly?
At the core of it, an anomaly is something that ‘deviates from normal’. Seems obvious, but an important consequence is that we can’t really define an anomaly without defining (implicitly or otherwise) exactly what ‘normal’ is. Seems easy, right? For any non-trivial system, absolutely not.
This assumption is probably the most common issue with so-called ‘automated anomaly detection’ routines — that there is a clear, universal definition of normal that can be applied to all operational data. Let’s go through some simple, intuitive definitions and see where they fail.
a. “Normal is…an expected range of values”
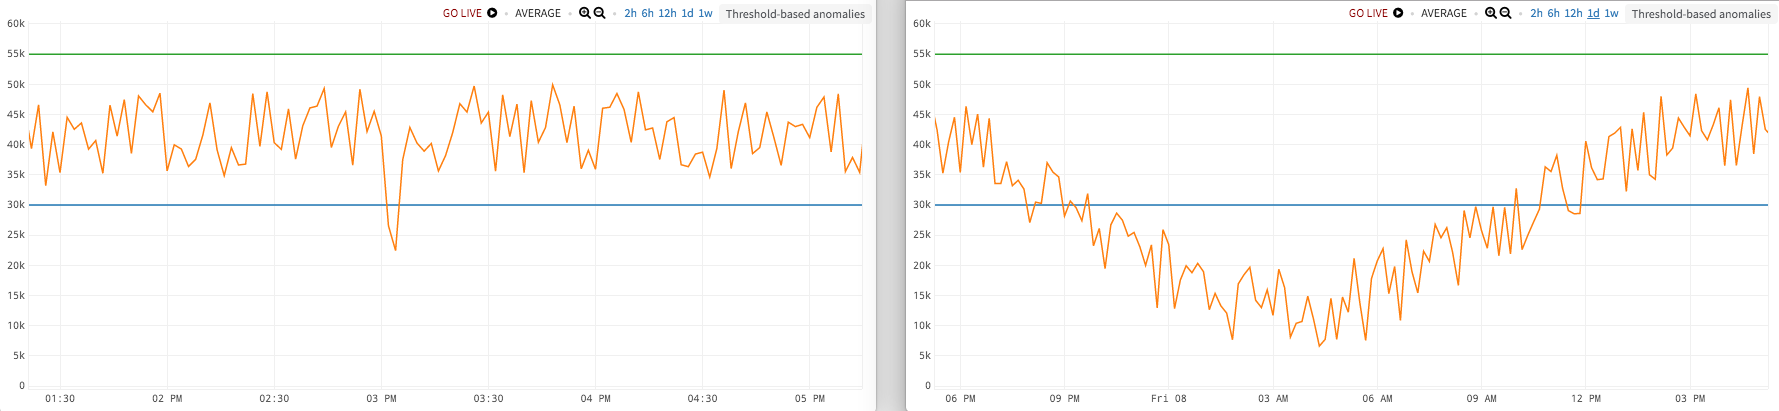
This is actually the original operational definition of ‘normal’, and why alerts have historically been threshold-based. You use thresholds to delineate the boundaries of the acceptable range, and anything outside of that range is automatically an anomaly. This works for some data.
But what if.…you have wildly different baselines between noon and midnight, or around Black Friday, or Cyber Monday? What if your data has some natural cycle/period, and is constantly in motion? In the figure on our left, our thresholds (green above, blue below) have caught the dip at 3 PM. But if you zoom out and look at a full 24 hour period (figure on the right), you can see that this metric drops way down in the middle of the night, certainly below any reasonable threshold we would want to use during the day.
b. “Normal is…a normal distribution”
Ok, you saw that one coming. But for a variety of reasons [4]., the normal (or Gaussian, or bell curve) distribution comes up again and again and again.
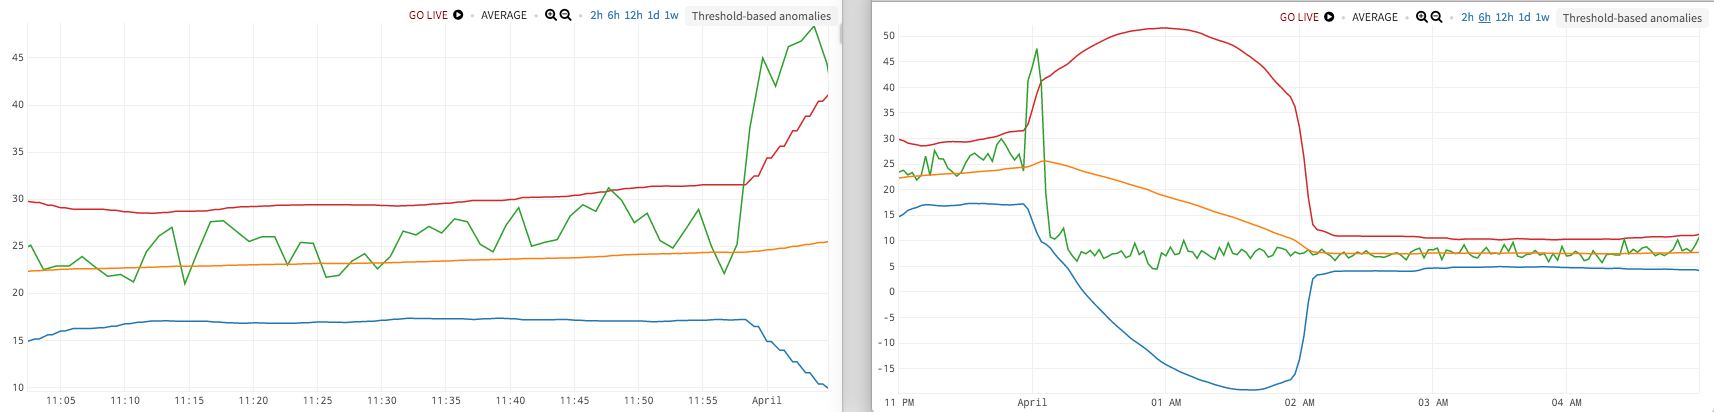
We can slap a windowed moving average and windowed standard deviation onto our data and look for things that are outside, say, three standard deviations. This also works for some data, some of the time. Here we’re going to use a variant of Bollinger Bands.
But what if…the baseline level of your data changes, and that’s important? In the first figure, we’ve caught a spike up at the far right of the chart, around midnight, which exceeds our three-standard-deviation envelope.
But….in the second figure, zooming out, we see that the data recovers after the spike but then overshoots down to below the original baseline, and stays there (going from a typical range of 20-30 down to about 5-10). Is that something you might want to know about?
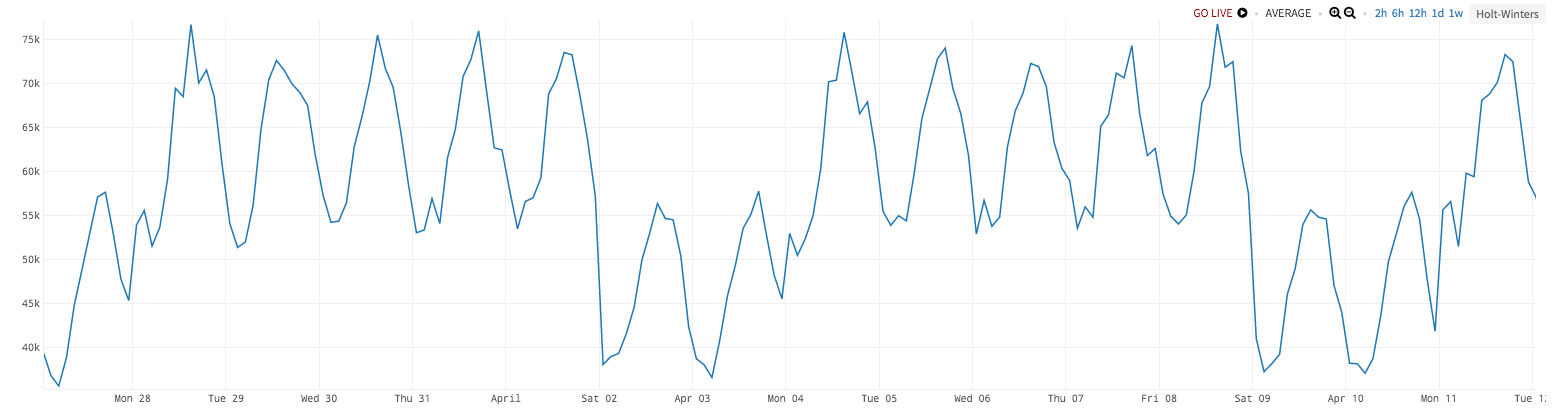
c. “Normal is…a trend plus seasonality”
This is often referred to as Holt-Winters, or triple exponential smoothing. The first issue here is that Holt-Winters is really a forecasting method, so it defines ‘normal’ a bit too tightly (as a single value rather than as a range/distribution). In practice, it will always be wrong, even if only by a tiny amount.
This means you need to add some other stuff on top of Holt-Winters for anomaly detection — authors have suggested modeling the residuals as a normal distribution, or using a median absolute deviation, among many alternatives. Let’s go with any of those for the moment.
But what if…you have two levels of seasonality, like variation across the hours of the day (day vs. night), as well as variation across days of the week (weekdays vs. weekends)? Even this simple (yet incredibly common) scenario breaks standard Holt-Winters, as in the two-week chart below.
Here, we see higher values on the weekdays than weekends (~65k vs. ~45k), and also higher values during the middle of the day vs. the middle of the night (~75k vs. ~55k). Holt-Winters will track one of these cycles but not the other [5].
I could go on. The day is young. I haven’t talked about ARIMA or Markov models or Bayesian approaches, each of which “work” on some data sets and not others.
But let me cut to the chase and point out that there is a shared pattern between all of these definitions — in essence, “normal” is defined to be whatever was predicted by some mathematical model of the data. When the prediction is violated, we have an anomaly. So far, so good.
So all we need is a universal predictor, based on some universal model (maybe a meta-model that auto-detects the ‘right’ simpler model from above, or from some longer list), find violations, and we’re done, right?
Right?
Unfortunately, this is mathematically impossible. [6]
All of this hand-wringing is for naught, though, because it turns out that the dictionary definition of “anomaly” wasn’t what customers were asking about, anyway.
3. OK, WHAT IS AN ANOMALY, REALLY?
Customers aren’t asking us to find all the incidents when their systems are “deviating from normal”— something in their system is always “deviating from normal”, by pretty much whatever definition of normal they want to choose [7], yet most of those deviations are utterly irrelevant.
What they’re really asking is “Show me anything that requires further action — as early as possible.” That’s all. If something doesn’t require further action (ever), it’s not really an anomaly, in the operational context — it’s a curiosity.
This also implies that all of the approaches that are based on statistical analysis of a data set (in a vacuum) are only part of the solution, and the easy part at that. The true ‘labels’ for anomalies aren’t in that data at all! They’re defined by whether the organization had to ultimately take action based on that data (or should have, based on what ensued).
Indeed, if you really wanted to address this problem using that framework, you would need a system capable of scaling to all of your real-time data, from business data to application and system metrics; a system that could query and analyze millions of points per second (in an operationally relevant time frame); a system with a language powerful enough to express a wide variety of real-world data scenarios yet easy enough to be understandable; and a system that contained historical event data on your operational interventions, real or desired (as the true labels to predict whether a given pattern across the data actually was an anomaly, in the practical, action-oriented sense).
In other words, a system like Wavefront.
Stay tuned.
FOOTNOTES
- This goes well beyond any individual time series being non-stationary (which they are); the underlying set of sources itself is constantly changing as old sources die/disconnect, new ones are spun up to replace/augment them, data gets backed up in customer-internal pipelines, etc. Most time series databases, conversely, make implicit assumptions that the set of sources is slowly changing and that data is reported near-real-time; when these assumptions are bent or broken, these storage layers have….issues.
- This includes many slow convergence machine learning techniques; the non-stationarity of the underlying data means you have to keep retraining the models on more recent, windowed data.
- “Worse” than flying blind includes watching metrics that give users a sense of false confidence but are basically not tied to larger system issues at all. Managing to these metrics is tantamount to pressing the “close door” button inside an elevator (“In most elevators, at least in any built or installed since the early nineties, the door-close button doesn’t work. It is there mainly to make you think it works. It does work if, say, a fireman needs to take control. But you need a key, and a fire, to do that.“, New Yorker).
- The conventional reason that “normal distributions are so normal”, showing up again and again, is because of the Central Limit Theorem — which basically states that if you sum/average enough independent and identical distributions (of any shape) together, you’ll approach the normal distribution. If what we observe in nature is made up of summations of thousands or millions of much less tractable distributions on smaller scales, you would see normal distributions everywhere. A more interesting possibility is suggested by the related fact that the normal distribution has the maximum entropy for a given mean/variance, so that the preponderance of normal distributions might be related more to a physical law — namely, the second law of thermodynamics. See Lyons (especially Section 4) for discussion.
- Taylor (2003) produced the most popular double-seasonality extension to Holt-Winters. However, Archibald (1990) showed that Holt-Winters can suffer from invertibility concerns, which would seem to apply to higher seasonality extensions as well. See also Hyndman (2007) for more on invertibility and Hyndman (2002) for approaches to confidence intervals in exponential smoothing.
- There is a beautiful mathematical theory (Solomonoff Induction, closely related to Algorithmic Probability) which shows us what optimal prediction would look like — an algorithm which can take any computable data set and latch onto it with perfect prediction, after a finite learning period with a few awkward, early mistakes (let’s call this adolescence). However (and you knew there would be a ‘however’), it also requires infinite computing power. In Solomonoff’s verbiage, any prediction algorithm which is complete is incomputable, and any algorithm which is computable is incomplete. This theory also implies that any approach based on finite computing power (meaning, you know, anything here in reality) will ultimately fail to predict some infinite set of deterministic, computable data sequences. In our particular context, that means that no matter how much data we have, or how much (finite) computing power we have, we will never be able to automatically and perfectly define what ‘normal’ is based on the data alone. We are lucky that perfection is not really the goal, because it’s never going to happen. To quote the statistician George Box, “All models are wrong, but some are [still] useful.”
- Operational data suffers mightily from the curse of dimensionality, which makes it hard to even collect enough data to define any (approximate) joint distribution on ‘normal’. Some of our customers have sent us more than 5 million unique time series (not individual data points, but individually named series — each of which contains many data points). Putting dimensionality reduction techniques aside for a second, if you run the hypersphere vs. hypercube thought experiment to see how ‘spiky’ this high-dimensional data is (or alternatively, how much of the volume is ‘near the middle’ rather than ‘in the corners’), the unit hypersphere is already <1% the volume of the unit hypercube at only 10 dimensions. At 5 million dimensions…
The post Why is Operational Anomaly Detection So Hard? appeared first on Wavefront by VMware.


