

Earlier this year, we released the Wavefront Collector for Kubernetes, supporting all popular flavors of Kubernetes: VMware Enterprise PKS and Tanzu, Pivotal Cloud Foundry, Red Hat OpenShift, Amazon EKS, Google GKE, Azure AKS, and others. With it, we were able to bring an entirely new set of capabilities to help you monitor and manage your Kubernetes deployments at scale, proven to support 200,000+ containers per cluster in use and 1,000s of developers.
Since then, we’ve been busy adding features to help you with usability and time to value.
Simple Installation for Kubernetes Observability
Having tackled the daemonset mode of installation with the prior release, we now have a Helm chart and an operator available to make it truly easy to install and lifecycle manage the Wavefront Collector for Kubernetes.
The Helm chart allows you to deploy the Wavefront Collector for Kubernetes and the Wavefront proxy to your Kubernetes cluster. Gone are the days where you had to manually edit and upload the YAML files. Depending on your architectural preference, you can even customize the chart to deploy multiple Wavefront proxies.
The Wavefront Operator for Kubernetes adds another level of ease to installing and maintaining the Wavefront Collector for Kubernetes and the Wavefront proxy. In addition to deployment, the operator helps with automatic updates for newer versions of the collector and proxy as they become available.
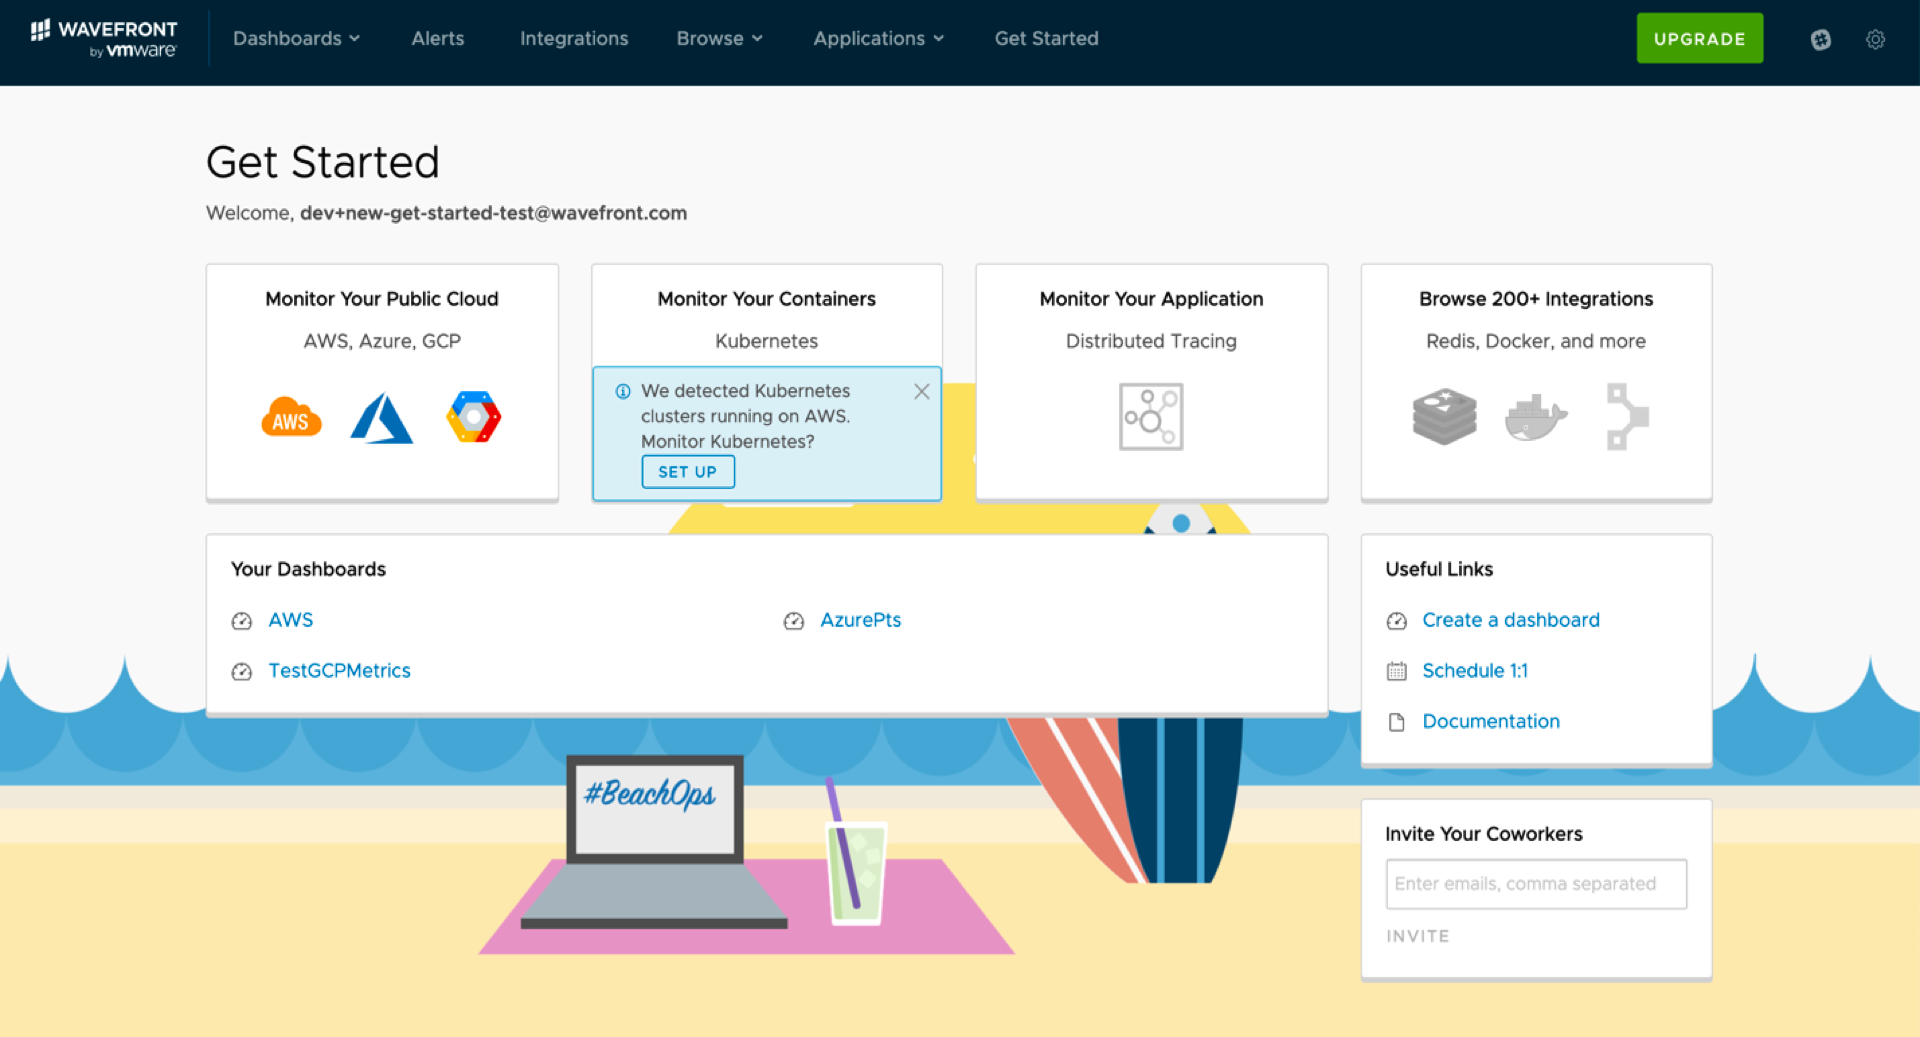 Figure 1: From Wavefront Get Started Choose to Monitor Your Containers and Kubernetes
Automated Detection of Your Kubernetes Clusters
As we started gathering feedback from our customers who use Kubernetes at scale, it became clear that it was time-consuming for Kubernetes administrators to keep track of the many clusters that were being spun up and to ensure that they were being monitored.
To help tackle this issue, Wavefront now automatically discovers all Kubernetes clusters in your Amazon EKS clusters. For each cluster that we detect, we give the administrators a customized one-liner to enable observability using the Wavefront Helm Chart for the Wavefront Operator for Kubernetes. When data flows in, we present dashboards to help administrators monitor and troubleshoot the Kubernetes environment.
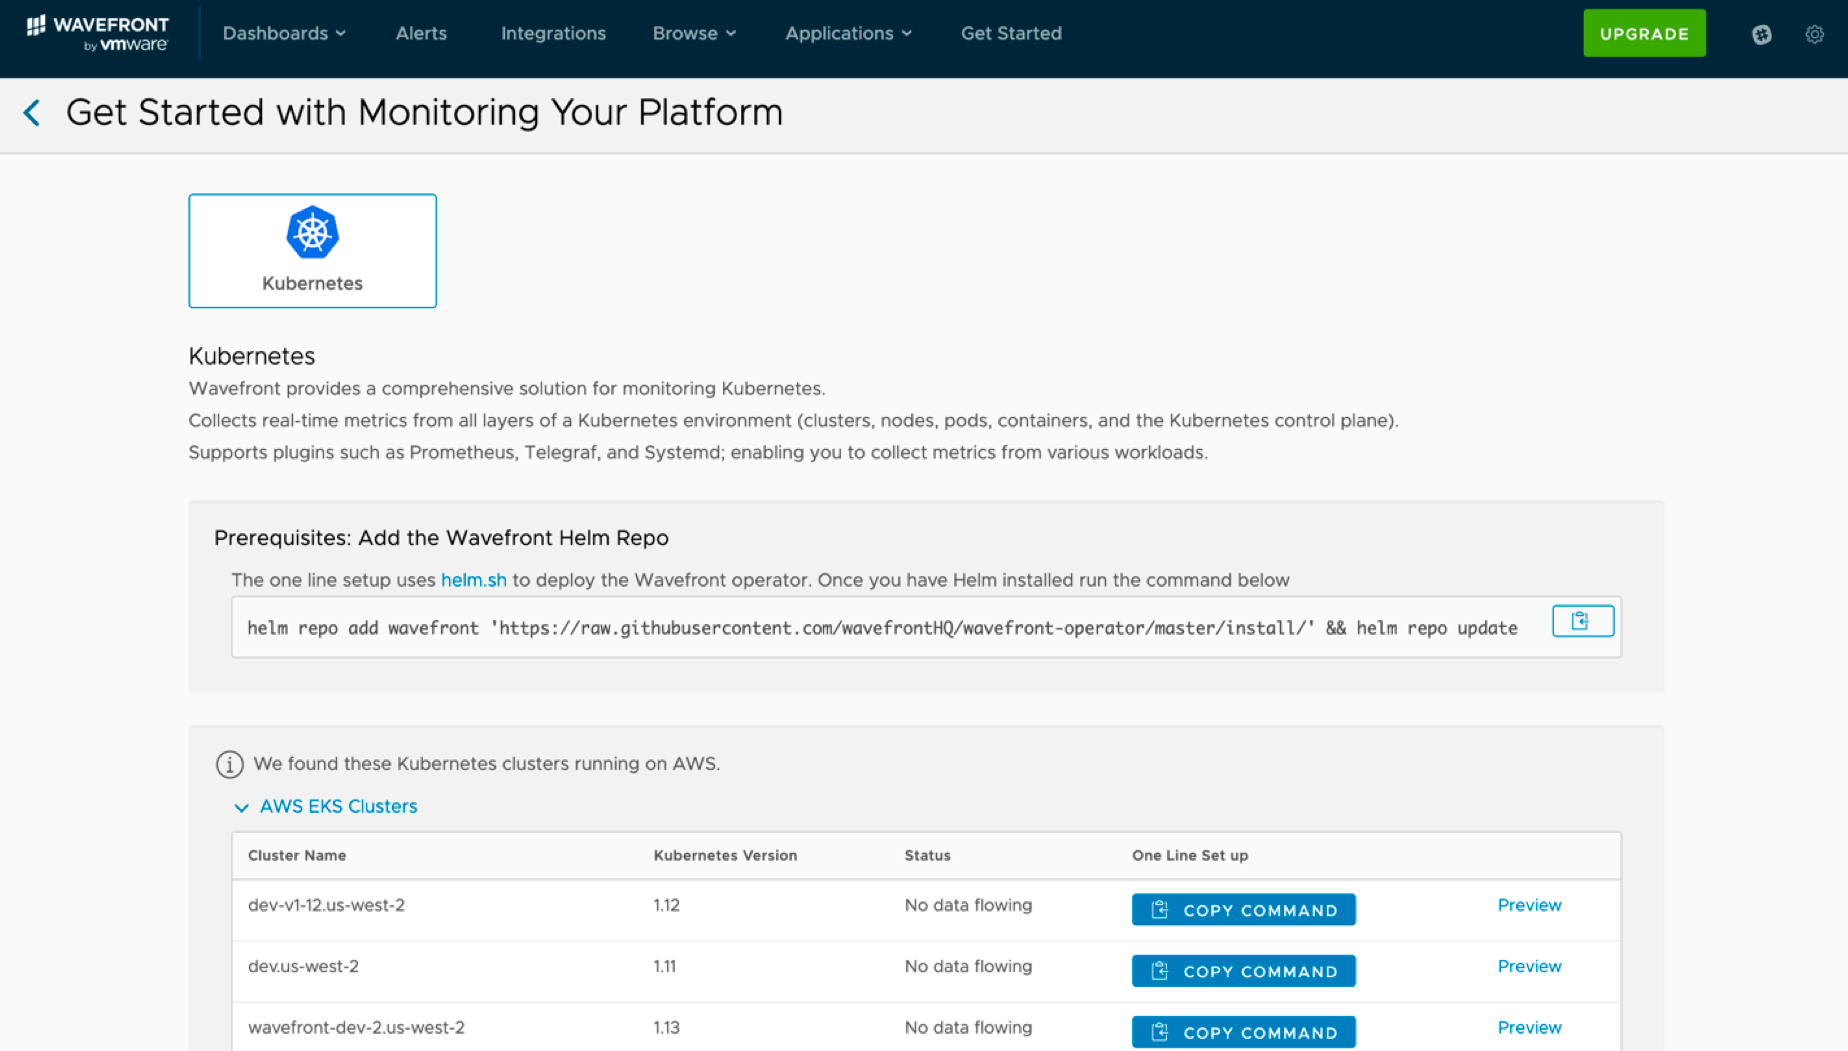 Figure 2: Wavefront Automatically Discovers Your Kubernetes Clusters
Automated Kubernetes Events for Faster Troubleshooting
In addition to collecting metrics, the latest version of the Wavefront Collector for Kubernetes now automatically ingests events from Kubernetes into Wavefront. With this ability, you can now visualize Kubernetes events in your charts and dashboards and gather additional context to help with monitoring and troubleshooting flows.
Out-Of-The-Box Dashboards for Kubernetes Troubleshooting
As the Kubernetes market matures, many Wavefront customers are starting to move their workloads to Kubernetes. While they are successfully adopting this technology at scale, they do not have the institutional monitoring and troubleshooting knowledge that early adopters have acquired by trial and error. As a result, we often run into customers who would benefit from a compilation of best practices that they can follow.
In a production environment, Wavefront can collect thousands of Kubernetes metrics every second. While all this data is important, to a new user, this often tends to be overwhelming. In situations like this, we tend to point users to our curated out-of-the-box dashboards. These dashboards are great for monitoring, but we wanted to help more in troubleshooting scenarios.
We decided to rethink the problem from the ground up and have created out-of-the-box Kubernetes troubleshooting dashboards that leverage the data that we already collect.
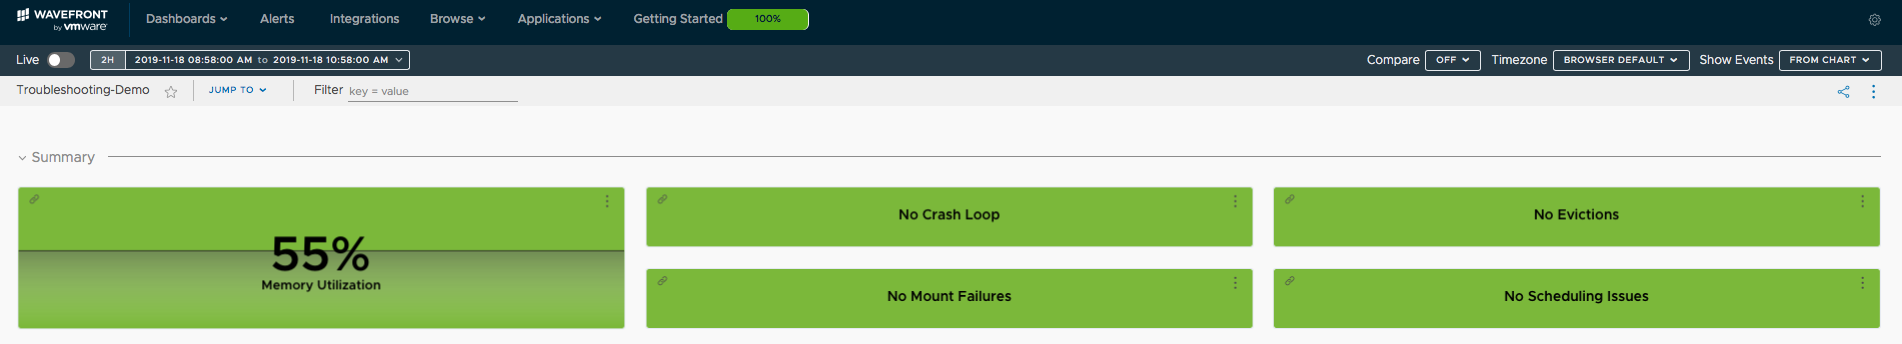 Figure 3: Wavefront Out-Of-The-Box Kubernetes Troubleshooting Dashboard
The new Wavefront Kubernetes troubleshooting dashboards keep track of a number of important metrics and events. When these metrics breach thresholds or when a known event is fired, Wavefront users see the metrics and information they need to troubleshoot the issue. By only surfacing relevant metrics in times of crisis, Wavefront protects users from being overwhelmed – they can focus on the problem at hand.
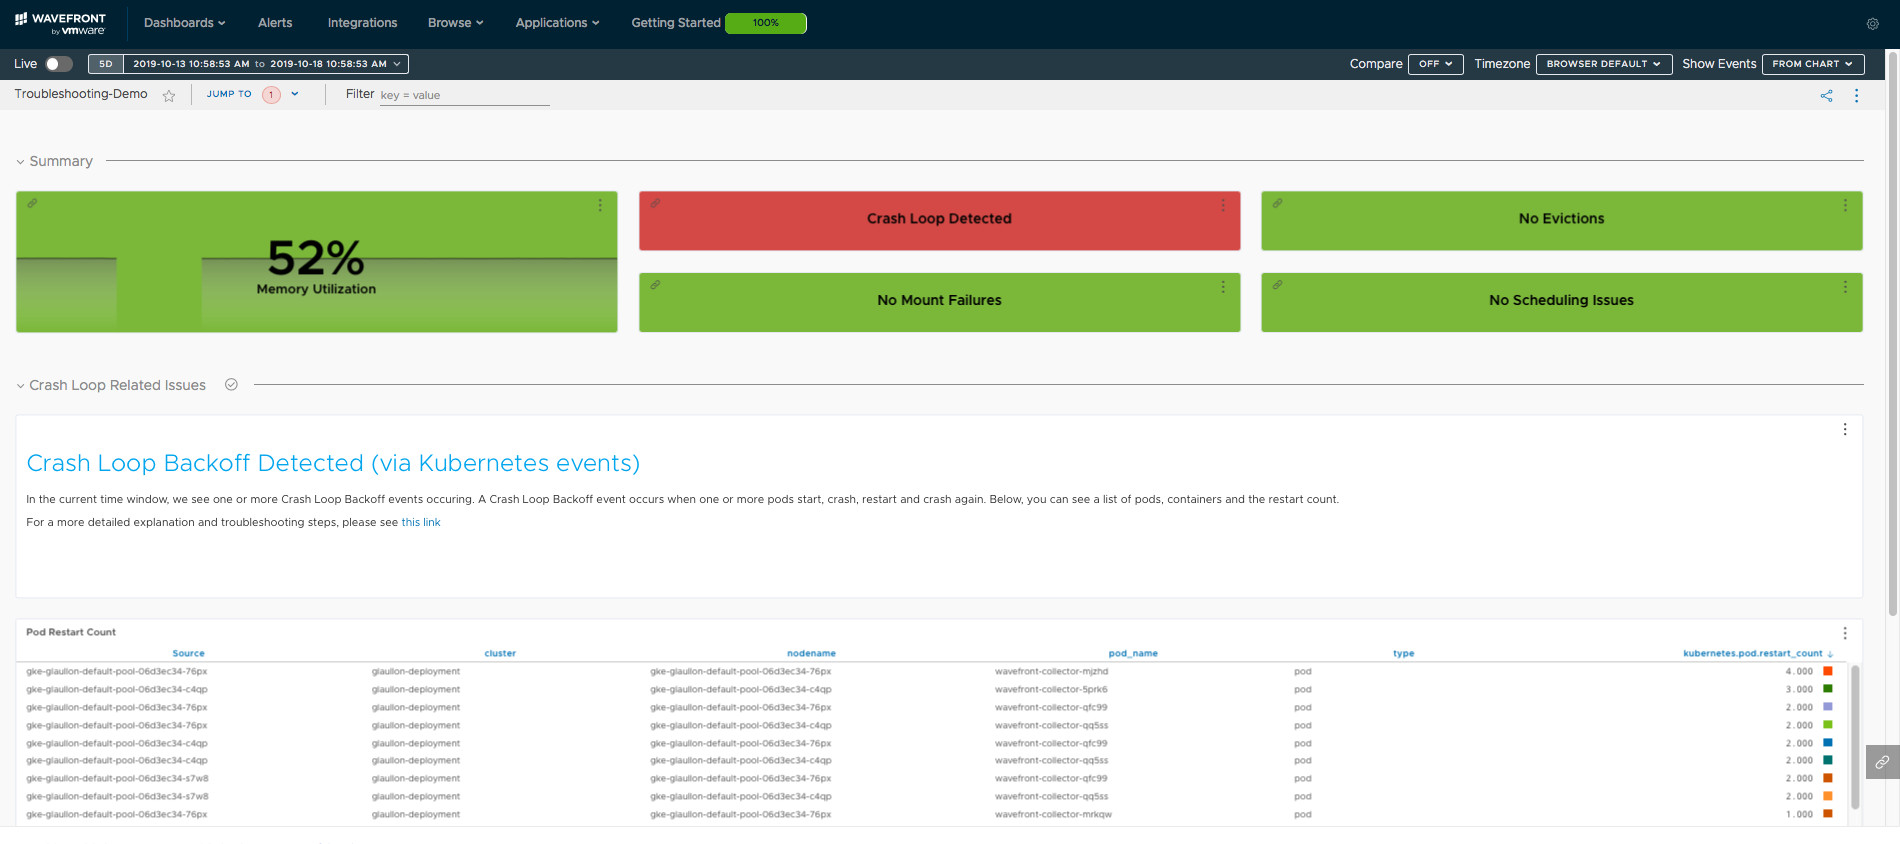 Figure 4: As Wavefront User, You See the Metrics and Information You Need to Troubleshoot the Issue
To get more details on Wavefront’s new troubleshooting dashboards for Kubernetes check out this demo.
Automated Observability Unifying Kubernetes and Applications
Wavefront recently released a Wavefront Java Tracing Agent to help gather traces from your Java services. In the Kubernetes context, we took this a step further and are now able to automatically attach the Wavefront Java Tracing Agent to a Java service that runs as a pod inside Kubernetes.
Available as an alpha capability, here’s how it works:
- The Wavefront Collector continuously monitors pods
- When a pod with the right annotation surfaces, the Wavefront Java Tracing Agent is dynamically attached
Thus, the Wavefront enterprise observability platform automates and unifies enterprise Kubernetes and applications visibility, delivering value to novice and mature users alike.
With these sets of expanded capabilities in Wavefront, monitoring and troubleshooting Kubernetes and its workloads are a breeze. Try the new capabilities! If you don’t have an account, sign up for a free trial at Wavefront.com/sign-up.
Get Started with Wavefront Follow @_karthiknarayan Follow @WavefrontHQThe post Wavefront Automates Observability for Enterprise Kubernetes appeared first on Wavefront by VMware.
About the Author
Follow on Twitter More Content by Karthik Narayan


